|
1700
|
How do I layout expandable columns
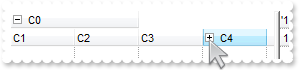
with G2antt1 do
begin
	BeginUpdate();
	ColumnAutoResize := False;
	DrawGridLines := EXG2ANTTLib_TLB.exAllLines;
	BackColorLevelHeader := BackColor;
	with Columns do
	begin
		with (IUnknown(Add('C0')) as EXG2ANTTLib_TLB.Column) do
		begin
			ExpandColumns := '1,2';
			DisplayExpandButton := True;
		end;
		Add('C1');
		Add('C2');
		Add('C3');
		with (IUnknown(Add('C4')) as EXG2ANTTLib_TLB.Column) do
		begin
			ExpandColumns := '5,6';
			DisplayExpandButton := True;
		end;
		Add('C5');
		with (IUnknown(Add('C6')) as EXG2ANTTLib_TLB.Column) do
		begin
			ExpandColumns := '6,7';
			DisplayExpandButton := True;
		end;
		Add('C7');
	end;
	EndUpdate();
	Columns.Item['C4'].Expanded := False;
end
|
|
1699
|
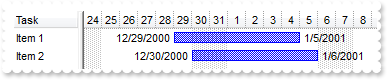
Is it possible to display automatically the start/end margins of the bars
with G2antt1 do
begin
	BeginUpdate();
	with Chart do
	begin
		FirstVisibleDate := '1/1/2001';
		PaneWidth[False] := 64;
		with Bars.Item['Task'] do
		begin
			Def[EXG2ANTTLib_TLB.exBarCaption] := '<%=%1%>';
			Def[EXG2ANTTLib_TLB.exBarHAlignCaption] := OleVariant(16);
			Def[EXG2ANTTLib_TLB.exBarExtraCaption] := '<%=%2%>';
			Def[EXG2ANTTLib_TLB.exBarExtraCaptionHAlign] := OleVariant(18);
		end;
		ScrollTo(FirstVisibleDate,OleVariant(1));
	end;
	Columns.Add('Task');
	(IUnknown(Columns.Add('ToolTip')) as EXG2ANTTLib_TLB.Column).Visible := False;
	with Items do
	begin
		h := AddItem('Item 1');
		CellValue[OleVariant(h),OleVariant(1)] := 'bar <b>a';
		AddBar(h,'Task','12/29/2000','1/5/2001',Null,Null);
		h := AddItem('Item 2');
		CellValue[OleVariant(h),OleVariant(1)] := 'bar <b>b';
		AddBar(h,'Task','12/30/2000','1/6/2001',Null,Null);
	end;
	EndUpdate();
end
|
|
1698
|
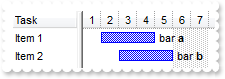
Is it possible to assign the bar's caption from a hidden column
with G2antt1 do
begin
	BeginUpdate();
	with Chart do
	begin
		FirstVisibleDate := '1/1/2001';
		PaneWidth[False] := 64;
		with Bars.Item['Task'] do
		begin
			Def[EXG2ANTTLib_TLB.exBarCaption] := '<%=%C1%>';
			Def[EXG2ANTTLib_TLB.exBarHAlignCaption] := OleVariant(18);
		end;
	end;
	Columns.Add('Task');
	(IUnknown(Columns.Add('ToolTip')) as EXG2ANTTLib_TLB.Column).Visible := False;
	with Items do
	begin
		h := AddItem('Item 1');
		CellValue[OleVariant(h),OleVariant(1)] := 'bar <b>a';
		AddBar(h,'Task','1/2/2001','1/5/2001',Null,Null);
		h := AddItem('Item 2');
		CellValue[OleVariant(h),OleVariant(1)] := 'bar <b>b';
		AddBar(h,'Task','1/3/2001','1/6/2001',Null,Null);
	end;
	EndUpdate();
end
|
|
1697
|
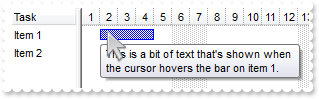
Is it possible to assign the bar's tooltip from a hidden column
with G2antt1 do
begin
	BeginUpdate();
	with Chart do
	begin
		FirstVisibleDate := '1/1/2001';
		PaneWidth[False] := 64;
		Bars.Item['Task'].Def[EXG2ANTTLib_TLB.exBarToolTip] := '<%=%C1%>';
	end;
	Columns.Add('Task');
	(IUnknown(Columns.Add('ToolTip')) as EXG2ANTTLib_TLB.Column).Visible := False;
	with Items do
	begin
		h := AddItem('Item 1');
		CellValue[OleVariant(h),OleVariant(1)] := 'This is a bit of text that''s shown when the cursor hovers the bar on item 1.';
		AddBar(h,'Task','1/2/2001','1/5/2001',Null,Null);
		h := AddItem('Item 2');
		CellValue[OleVariant(h),OleVariant(1)] := 'This is a bit of text that''s shown when the cursor hovers the bar on item 2.';
		AddBar(h,'Task','1/3/2001','1/6/2001',Null,Null);
	end;
	EndUpdate();
end
|
|
1696
|
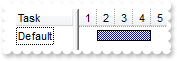
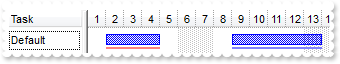
I am using exBarFrameColor, but no black frame is shown. What could be wrong (method 2)

with G2antt1 do
begin
	BeginUpdate();
	with Chart do
	begin
		FirstVisibleDate := '1/1/2001';
		PaneWidth[False] := 128;
	end;
	Columns.Add('Task');
	with Items do
	begin
		h := AddItem('Default');
		AddBar(h,'Task','1/2/2001','1/5/2001',Null,Null);
		ItemBar[h,'',EXG2ANTTLib_TLB.exBarFrameColor] := OleVariant(65536);
	end;
	EndUpdate();
end
|
|
1695
|
I am using exBarFrameColor, but no black frame is shown. What could be wrong (method 1)
with G2antt1 do
begin
	BeginUpdate();
	with Chart do
	begin
		FirstVisibleDate := '1/1/2001';
		PaneWidth[False] := 128;
		Bars.Item['Task'].Def[EXG2ANTTLib_TLB.exBarFrameColor] := OleVariant(65536);
	end;
	Columns.Add('Task');
	with Items do
	begin
		AddBar(AddItem('Default'),'Task','1/2/2001','1/5/2001',Null,Null);
	end;
	EndUpdate();
end
|
|
1694
|
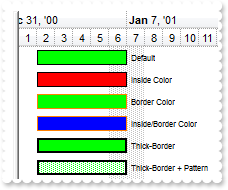
What I need is bars that have a solid color, but with a black frame. How can we do that
with G2antt1 do
begin
	BeginUpdate();
	DefaultItemHeight := 22;
	with Chart do
	begin
		FirstVisibleDate := '1/1/2001';
		LevelCount := 2;
		PaneWidth[False] := 0;
	end;
	with Chart.Bars.Add('Frame') do
	begin
		Pattern := EXG2ANTTLib_TLB.exPatternSolid;
		Color := $ff00;
		Def[EXG2ANTTLib_TLB.exBarFrameColor] := OleVariant(65536);
		Def[EXG2ANTTLib_TLB.exBarCaption] := '<font ;6><%=%C0%>';
		Def[EXG2ANTTLib_TLB.exBarHAlignCaption] := OleVariant(18);
		Height := 15;
	end;
	Columns.Add('Frames');
	with Items do
	begin
		AddBar(AddItem('Default'),'Frame','1/2/2001','1/7/2001',Null,Null);
		h := AddItem('Inside Color');
		AddBar(h,'Frame','1/2/2001','1/7/2001',Null,Null);
		ItemBar[h,'',EXG2ANTTLib_TLB.exBarColor] := OleVariant(255);
		h := AddItem('Border Color');
		AddBar(h,'Frame','1/2/2001','1/7/2001',Null,Null);
		ItemBar[h,'',EXG2ANTTLib_TLB.exBarFrameColor] := OleVariant(33023);
		h := AddItem('Inside/Border Color');
		AddBar(h,'Frame','1/2/2001','1/7/2001',Null,Null);
		ItemBar[h,'',EXG2ANTTLib_TLB.exBarColor] := OleVariant(16711680);
		ItemBar[h,'',EXG2ANTTLib_TLB.exBarFrameColor] := OleVariant(33023);
		h := AddItem('Thick-Border');
		AddBar(h,'Frame','1/2/2001','1/7/2001',Null,Null);
		ItemBar[h,'',EXG2ANTTLib_TLB.exBarPattern] := OleVariant(4097);
		h := AddItem('Thick-Border + Pattern');
		AddBar(h,'Frame','1/2/2001','1/7/2001',Null,Null);
		ItemBar[h,'',EXG2ANTTLib_TLB.exBarPattern] := OleVariant(4098);
	end;
	EndUpdate();
end
|
|
1693
|
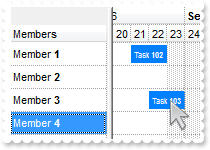
How can we drag bars from one item to the other
with G2antt1 do
begin
	BeginUpdate();
	DefaultItemHeight := 22;
	DrawGridLines := EXG2ANTTLib_TLB.exAllLines;
	(IUnknown(Columns.Add('Members')) as EXG2ANTTLib_TLB.Column).Def[EXG2ANTTLib_TLB.exCellValueFormat] := OleVariant(1);
	with Chart do
	begin
		FirstVisibleDate := '9/20/2006';
		AllowLinkBars := False;
		AllowCreateBar := EXG2ANTTLib_TLB.exNoCreateBar;
		AllowSelectObjects := EXG2ANTTLib_TLB.exNoSelectObjects;
		LevelCount := 2;
		PaneWidth[False] := 96;
		DrawGridLines := EXG2ANTTLib_TLB.exAllLines;
		with Bars.Item['Task'] do
		begin
			OverlaidType := Integer(EXG2ANTTLib_TLB.exOverlaidBarsIncludeCaption) Or Integer(EXG2ANTTLib_TLB.exOverlaidBarsStackAutoArrange) Or Integer(EXG2ANTTLib_TLB.exOverlaidBarsStack);
			Height := 18;
			Pattern := EXG2ANTTLib_TLB.exPatternSolid;
			Color := $ff8000;
		end;
	end;
	with Items do
	begin
		h := AddItem('Member <b>1</b>');
		AddBar(h,'Task','9/21/2006','9/23/2006','T102','<font ;6><fgcolor FFFFFF>Task <b>102</b>');
		ItemBar[h,'T102',EXG2ANTTLib_TLB.exBarCanMoveToAnother] := OleVariant(True);
		h := AddItem('Member <b>2</b>');
		h := AddItem('Member <b>3</b>');
		h := AddItem('Member <b>4</b>');
		AddBar(h,'Task','9/21/2006','9/23/2006','T103','<font ;6><fgcolor FFFFFF>Task <b>103</b>');
		ItemBar[h,'T103',EXG2ANTTLib_TLB.exBarCanMoveToAnother] := OleVariant(True);
	end;
	EndUpdate();
end
|
|
1692
|
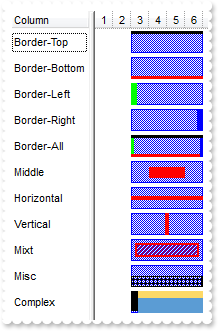
How can I use the exBarBackgroundExt option of the Items.ItemBar property
with G2antt1 do
begin
	BeginUpdate();
	DefaultItemHeight := 26;
	with Chart do
	begin
		NonworkingDays := 0;
		FirstVisibleDate := '1/1/2001';
		PaneWidth[False] := 128;
		Bars.Item['Task'].Height := 22;
	end;
	Columns.Add('Column');
	with Items do
	begin
		h := AddItem('Border-Top');
		AddBar(h,'Task','1/3/2001','1/7/2001',Null,Null);
		ItemBar[h,'',EXG2ANTTLib_TLB.exBarBackgroundExt] := 'top[3,back=RGB(0,0,0)]';
		h := AddItem('Border-Bottom');
		AddBar(h,'Task','1/3/2001','1/7/2001',Null,Null);
		ItemBar[h,'',EXG2ANTTLib_TLB.exBarBackgroundExt] := 'bottom[3,back=RGB(255,0,0)]';
		h := AddItem('Border-Left');
		AddBar(h,'Task','1/3/2001','1/7/2001',Null,Null);
		ItemBar[h,'',EXG2ANTTLib_TLB.exBarBackgroundExt] := 'left[6,back=RGB(0,255,0)]';
		h := AddItem('Border-Right');
		AddBar(h,'Task','1/3/2001','1/7/2001',Null,Null);
		ItemBar[h,'',EXG2ANTTLib_TLB.exBarBackgroundExt] := 'right[6,back=RGB(0,0,255)]';
		h := AddItem('Border-All');
		AddBar(h,'Task','1/3/2001','1/7/2001',Null,Null);
		ItemBar[h,'',EXG2ANTTLib_TLB.exBarBackgroundExt] := 'top[3,back=RGB(0,0,0)],right[3,back=RGB(0,0,255)],bottom[3,back=RGB(255,0,0)],left[3,back=RGB(0,255,0)],client';
		h := AddItem('Middle');
		AddBar(h,'Task','1/3/2001','1/7/2001',Null,Null);
		ItemBar[h,'',EXG2ANTTLib_TLB.exBarBackgroundExt] := 'none[(25%,25%,50%,50%),back=RGB(255,0,0)]';
		h := AddItem('Horizontal');
		AddBar(h,'Task','1/3/2001','1/7/2001',Null,Null);
		ItemBar[h,'',EXG2ANTTLib_TLB.exBarBackgroundExt] := 'none[(0,50%-2,100%,4),back=RGB(255,0,0)]';
		h := AddItem('Vertical');
		AddBar(h,'Task','1/3/2001','1/7/2001',Null,Null);
		ItemBar[h,'',EXG2ANTTLib_TLB.exBarBackgroundExt] := 'none[(50%-2,0,4,100%),back=RGB(255,0,0)]';
		h := AddItem('Mixt');
		AddBar(h,'Task','1/3/2001','1/7/2001',Null,Null);
		ItemBar[h,'',EXG2ANTTLib_TLB.exBarBackgroundExt] := '[[patterncolor=RGB(255,0,0)](none[(4,4,100%-8,100%-8),pattern=0x006,patterncolor=RGB(255,0,0),frame=RGB(255,0,0),framethick])]';
		h := AddItem('Misc');
		AddBar(h,'Task','1/3/2001','1/7/2001',Null,Null);
		ItemBar[h,'',EXG2ANTTLib_TLB.exBarBackgroundExt] := 'bottom[50%,pattern=10,frame]';
		h := AddItem('Complex');
		AddBar(h,'Task','1/3/2001','1/7/2001',Null,Null);
		ItemBar[h,'',EXG2ANTTLib_TLB.exBarBackgroundExt] := 'left[10%](top[90%,back=RGB(0,0,0)]),top[30%,back=RGB(254,217,102)],client[back=RGB(91,156,212)]';
	end;
	EndUpdate();
end
|
|
1691
|
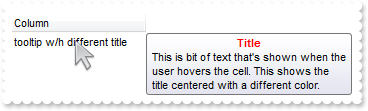
Does the title of the cell's tooltip supports HTML format
with G2antt1 do
begin
	BeginUpdate();
	Chart.PaneWidth[True] := 0;
	with (IUnknown(Columns.Add('')) as EXG2ANTTLib_TLB.Column) do
	begin
		Caption := '';
		HTMLCaption := 'Column';
	end;
	with Items do
	begin
		CellToolTip[OleVariant(AddItem('tooltip w/h different title')),OleVariant(0)] := '<c><b><fgcolor=FF0000>Title</fgcolor></b><br>This is bit of text that''s shown when the user hovers the cell. This shows the titl' +
	'e centered with a different color.';
	end;
	EndUpdate();
end
|
|
1690
|
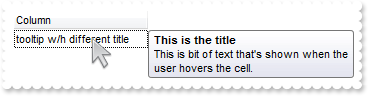
How do I specify a different title for the cell's tooltip
with G2antt1 do
begin
	BeginUpdate();
	Chart.PaneWidth[True] := 0;
	with (IUnknown(Columns.Add('')) as EXG2ANTTLib_TLB.Column) do
	begin
		Caption := 'This is the title';
		HTMLCaption := 'Column';
	end;
	with Items do
	begin
		CellToolTip[OleVariant(AddItem('tooltip w/h different title')),OleVariant(0)] := 'This is bit of text that''s shown when the user hovers the cell.';
	end;
	EndUpdate();
end
|
|
1689
|
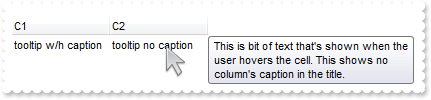
The cell's tooltip displays the column's caption in its title. How can I get ride of that
with G2antt1 do
begin
	BeginUpdate();
	Chart.PaneWidth[True] := 0;
	with Columns do
	begin
		Add('C1');
		Add('C2');
	end;
	with Items do
	begin
		h := AddItem('tooltip w/h caption');
		CellToolTip[OleVariant(h),OleVariant(0)] := 'This is bit of text that''s shown when the user hovers the cell. This shows the column''s caption in the title.';
		CellValue[OleVariant(h),OleVariant(1)] := 'tooltip no caption';
		CellToolTip[OleVariant(h),OleVariant(1)] := 'This is bit of text that''s shown when the user hovers the cell. This shows no column''s caption in the title.';
	end;
	with Columns.Item['C2'] do
	begin
		HTMLCaption := Caption;
		Caption := '';
	end;
	EndUpdate();
end
|
|
1688
|
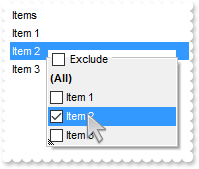
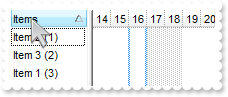
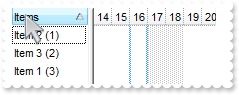
How can I programmatically show the column's filter
// RClick event - Fired when right mouse button is clicked
procedure TForm1.G2antt1RClick(ASender: TObject; );
begin
	// Columns(c).ShowFilter("-1,-1,128,128")
	with G2antt1 do
	begin
		i := ItemFromPoint[-1,-1,c,hit];
	end
end;

with G2antt1 do
begin
	BeginUpdate();
	ShowFocusRect := False;
	with (IUnknown(Columns.Add('Items ')) as EXG2ANTTLib_TLB.Column) do
	begin
		DisplayFilterPattern := False;
		FilterList := Integer(EXG2ANTTLib_TLB.exShowExclude) Or Integer(EXG2ANTTLib_TLB.exShowFocusItem) Or Integer(EXG2ANTTLib_TLB.exShowCheckBox);
	end;
	with Items do
	begin
		AddItem('Item 1');
		AddItem('Item 2');
		AddItem('Item 3');
	end;
	EndUpdate();
end
|
|
1687
|
I want to be able to click on one of the headers, and sort by other column. How can I do that (method 2)
// ColumnClick event - Fired after the user clicks on column's header.
procedure TForm1.G2antt1ColumnClick(ASender: TObject; Column : IColumn);
begin
	// Column.SortOrder = 1
	with G2antt1 do
	begin
		SortOnClick := EXG2ANTTLib_TLB.exDefaultSort;
		Columns.Item['Sort'].SortOrder := EXG2ANTTLib_TLB.SortAscending;
		SortOnClick := EXG2ANTTLib_TLB.exUserSort;
	end
end;

with G2antt1 do
begin
	BeginUpdate();
	SortOnClick := EXG2ANTTLib_TLB.exUserSort;
	Columns.Add('Items');
	(IUnknown(Columns.Add('Sort')) as EXG2ANTTLib_TLB.Column).Visible := False;
	with Items do
	begin
		CellValue[OleVariant(AddItem('Item 1 (3)')),OleVariant(1)] := OleVariant(3);
		CellValue[OleVariant(AddItem('Item 2 (1)')),OleVariant(1)] := OleVariant(1);
		CellValue[OleVariant(AddItem('Item 3 (2)')),OleVariant(1)] := OleVariant(2);
	end;
	EndUpdate();
end
|
|
1686
|
I want to be able to click on one of the headers, and sort by other column. How can I do that (method 1)
// ColumnClick event - Fired after the user clicks on column's header.
procedure TForm1.G2antt1ColumnClick(ASender: TObject; Column : IColumn);
begin
	// Column.SortOrder = 1
	with G2antt1 do
	begin
		Items.SortChildren(0,'Sort',True);
	end
end;

with G2antt1 do
begin
	BeginUpdate();
	SortOnClick := EXG2ANTTLib_TLB.exUserSort;
	Columns.Add('Items');
	(IUnknown(Columns.Add('Sort')) as EXG2ANTTLib_TLB.Column).Visible := False;
	with Items do
	begin
		CellValue[OleVariant(AddItem('Item 1 (3)')),OleVariant(1)] := OleVariant(3);
		CellValue[OleVariant(AddItem('Item 2 (1)')),OleVariant(1)] := OleVariant(1);
		CellValue[OleVariant(AddItem('Item 3 (2)')),OleVariant(1)] := OleVariant(2);
	end;
	EndUpdate();
end
|
|
1685
|
How do I get information about control's events
// Event event - Notifies the application once the control fires an event.
procedure TForm1.G2antt1Event(ASender: TObject; EventID : Integer);
begin
	with G2antt1 do
	begin
		OutputDebugString( ExecuteTemplate('EventParam(-2)') );
	end
end;

with G2antt1 do
begin
	BeginUpdate();
	with Chart do
	begin
		FirstVisibleDate := '1/1/2001';
		PaneWidth[False] := 48;
		AllowLinkBars := False;
		Bars.Item['Task'].OverlaidType := Integer(EXG2ANTTLib_TLB.exOverlaidBarsTransparent) Or Integer(EXG2ANTTLib_TLB.exOverlaidBarsOffset);
	end;
	Columns.Add('Column');
	with Items do
	begin
		h := AddItem('Item 1');
		EnableItem[h] := False;
		ItemData[h] := OleVariant(-1);
		h := AddItem('Item 2');
		ItemData[h] := OleVariant(0);
		AddBar(h,'Task','1/5/2001','1/7/2001','B',Null);
		ItemBar[h,'B',EXG2ANTTLib_TLB.exBarCanMoveToAnother] := OleVariant(True);
		ItemData[AddItem('Item 3')] := OleVariant(0);
		h := AddItem('Item 4');
		EnableItem[h] := False;
		ItemData[h] := OleVariant(-1);
	end;
	EndUpdate();
end
|
|
1684
|
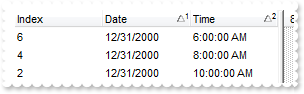
How can I sort by two-columns, one by date and one by time
with G2antt1 do
begin
	BeginUpdate();
	SingleSort := False;
	with Columns do
	begin
		(IUnknown(Add('Index')) as EXG2ANTTLib_TLB.Column).FormatColumn := '1 index ``';
		(IUnknown(Add('Date')) as EXG2ANTTLib_TLB.Column).SortType := EXG2ANTTLib_TLB.SortDate;
		with (IUnknown(Add('Time')) as EXG2ANTTLib_TLB.Column) do
		begin
			SortType := EXG2ANTTLib_TLB.SortTime;
			FormatColumn := 'time(value)';
		end;
	end;
	with Items do
	begin
		h := AddItem(OleVariant(0));
		CellValue[OleVariant(h),OleVariant(1)] := '1/1/2001';
		CellValue[OleVariant(h),OleVariant(2)] := '1/1/2001 10:00:00 AM';
		h := AddItem(OleVariant(0));
		CellValue[OleVariant(h),OleVariant(1)] := '12/31/2000';
		CellValue[OleVariant(h),OleVariant(2)] := '1/1/2001 10:00:00 AM';
		h := AddItem(OleVariant(0));
		CellValue[OleVariant(h),OleVariant(1)] := '1/1/2001';
		CellValue[OleVariant(h),OleVariant(2)] := '1/1/2001 6:00:00 AM';
		h := AddItem(OleVariant(0));
		CellValue[OleVariant(h),OleVariant(1)] := '12/31/2000';
		CellValue[OleVariant(h),OleVariant(2)] := '1/1/2001 8:00:00 AM';
		h := AddItem(OleVariant(0));
		CellValue[OleVariant(h),OleVariant(1)] := '1/1/2001';
		CellValue[OleVariant(h),OleVariant(2)] := '1/1/2001 8:00:00 AM';
		h := AddItem(OleVariant(0));
		CellValue[OleVariant(h),OleVariant(1)] := '12/31/2000';
		CellValue[OleVariant(h),OleVariant(2)] := '1/1/2001 6:00:00 AM';
	end;
	Layout := 'multiplesort="C1:1 C2:1"';
	EndUpdate();
end
|
|
1683
|
I am trying to hide the non-working dates by using the AddNonworkingDate to specify custom non-working dates while NonworkingDays property is 0, but the non-working date is still shown. What can be wrong
with G2antt1 do
begin
	BeginUpdate();
	with Chart do
	begin
		FirstVisibleDate := '1/1/2008';
		PaneWidth[False] := 0;
		LevelCount := 2;
		ShowNonworkingUnits := False;
		ShowNonworkingDates := False;
		NonworkingDays := 128;
		AddNonworkingDate('1/7/2008');
		AddNonworkingDate('1/8/2008');
		AddNonworkingDate('1/9/2008');
		AddNonworkingDate('1/10/2008');
	end;
	EndUpdate();
end
|
|
1682
|
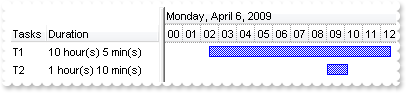
How can I display the task's duration, in days, hours and minutes
with G2antt1 do
begin
	BeginUpdate();
	with (IUnknown(Columns.Add('Tasks')) as EXG2ANTTLib_TLB.Column) do
	begin
		AllowSizing := False;
		Width := 36;
	end;
	with (IUnknown(Columns.Add('Duration')) as EXG2ANTTLib_TLB.Column) do
	begin
		Def[EXG2ANTTLib_TLB.exCellValueToItemBarProperty] := OleVariant(513);
		FormatColumn := '((1:=int(0:= (value))) != 0 ? (=:1 + '' day(s)'') : '''') + (=:1 ? '' '' : '''' ) + ((1:=int(0:=((=:0 - =:1 + 1/24/60/60/2)*24))) != 0 ?' +
	' =:1 + '' hour(s)'' : '''' ) + (=:1 ? '' '' : '''' ) + ((1:=round((=:0 - =:1)*60)) != 0 ? =:1 + '' min(s)'' : '''')';
	end;
	with Chart do
	begin
		PaneWidth[False] := 148;
		FirstVisibleDate := '4/6/2009';
		LevelCount := 2;
		UnitScale := EXG2ANTTLib_TLB.exHour;
		ResizeUnitScale := EXG2ANTTLib_TLB.exMinute;
	end;
	Items.AllowCellValueToItemBar := True;
	with Items do
	begin
		AddBar(AddItem('T1'),'Task','4/6/2009 2:30:00 AM','4/6/2009 12:35:00 PM',Null,Null);
		AddBar(AddItem('T2'),'Task','4/6/2009 9:00:00 AM','4/6/2009 10:10:00 AM',Null,Null);
	end;
	EndUpdate();
end
|
|
1681
|
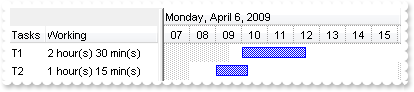
Does your control support working half-hour/minutes/seconds
with G2antt1 do
begin
	BeginUpdate();
	with (IUnknown(Columns.Add('Tasks')) as EXG2ANTTLib_TLB.Column) do
	begin
		AllowSizing := False;
		Width := 36;
	end;
	with (IUnknown(Columns.Add('Working')) as EXG2ANTTLib_TLB.Column) do
	begin
		Def[EXG2ANTTLib_TLB.exCellValueToItemBarProperty] := OleVariant(258);
		FormatColumn := '((1:=int(0:= (value))) != 0 ? (=:1 + '' day(s)'') : '''') + (=:1 ? '' '' : '''' ) + ((1:=int(0:=((=:0 - =:1 + 1/24/60/60/2)*24))) != 0 ?' +
	' =:1 + '' hour(s)'' : '''' ) + (=:1 ? '' '' : '''' ) + ((1:=round((=:0 - =:1)*60)) != 0 ? =:1 + '' min(s)'' : '''')';
	end;
	with Chart do
	begin
		FirstVisibleDate := '4/6/2009';
		PaneWidth[False] := 148;
		LevelCount := 2;
		UnitScale := EXG2ANTTLib_TLB.exHour;
		ResizeUnitScale := EXG2ANTTLib_TLB.exMinute;
		ResizeUnitCount := 15;
		NonworkingHours := 15728767;
		ShowNonworkingDates := False;
		ShowNonworkingUnits := False;
		ShowNonworkingHours := False;
		with Bars do
		begin
			Add('Task:Split').Shortcut := 'Task';
			Item['Task'].Def[EXG2ANTTLib_TLB.exBarKeepWorkingCount] := OleVariant(True);
		end;
		AllowLinkBars := False;
		UnitWidth := 26;
	end;
	Items.AllowCellValueToItemBar := True;
	with Items do
	begin
		h := AddItem('T1');
		ItemNonworkingUnits[h,OleVariant(False)] := '(weekday(value) in (1,2,3,4,5) and (timeF(value)<"09:30"  or timeF(value)>="17:30")) or (weekday(value) in (0,6))';
		AddBar(h,'Task','4/6/2009 10:00:00 AM','4/6/2009 12:30:00 PM',Null,Null);
		h := AddItem('T2');
		ItemNonworkingUnits[h,OleVariant(False)] := '(weekday(value) in (1,2,3,4,5) and (timeF(value)<"08:00"  or timeF(value)>="16:00")) or (weekday(value) in (0,6))';
		AddBar(h,'Task','4/6/2009 9:30:00 AM','4/6/2009 10:45:00 AM',Null,Null);
	end;
	EndUpdate();
end
|
|
1680
|
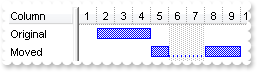
How can I programmatically move a bar to a specified date-time
with G2antt1 do
begin
	BeginUpdate();
	with Chart do
	begin
		FirstVisibleDate := '1/1/2001';
		PaneWidth[False] := 64;
	end;
	Columns.Add('Column');
	with Items do
	begin
		h := AddItem('Original');
		AddBar(h,'Task','1/2/2001','1/5/2001','key',Null);
		h := AddItem('Moved');
		AddBar(h,'Task','1/2/2001','1/5/2001','key',Null);
		duration := ItemBar[h,'key',EXG2ANTTLib_TLB.exBarDuration];
		AddBar(h,'Task','1/5/2001','1/5/2001','key',Null);
		ItemBar[h,'key',EXG2ANTTLib_TLB.exBarDuration] := OleVariant(duration);
	end;
	EndUpdate();
end
|
|
1679
|
How can I programmatically move a bar, with a specified ammount
with G2antt1 do
begin
	BeginUpdate();
	with Chart do
	begin
		FirstVisibleDate := '1/1/2001';
		PaneWidth[False] := 64;
	end;
	Columns.Add('Column');
	with Items do
	begin
		h := AddItem('Original');
		AddBar(h,'Task','1/2/2001','1/5/2001','key',Null);
		h := AddItem('Moved');
		AddBar(h,'Task','1/2/2001','1/5/2001','key',Null);
		ItemBar[h,'key',EXG2ANTTLib_TLB.exBarMove] := OleVariant(3);
	end;
	EndUpdate();
end
|
|
1678
|
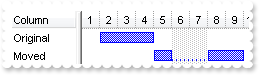
How can I programmatically move a bar to a specified date-time (auto-adjust spans over a non-working period)
with G2antt1 do
begin
	BeginUpdate();
	with Chart do
	begin
		FirstVisibleDate := '1/1/2001';
		PaneWidth[False] := 64;
		with Bars do
		begin
			Item['Task'].Def[EXG2ANTTLib_TLB.exBarKeepWorkingCount] := OleVariant(True);
			Add('Task:Split').Shortcut := 'Task';
		end;
	end;
	Columns.Add('Column');
	with Items do
	begin
		h := AddItem('Original');
		AddBar(h,'Task','1/2/2001','1/5/2001','key',Null);
		h := AddItem('Moved');
		AddBar(h,'Task','1/2/2001','1/5/2001','key',Null);
		workingCount := ItemBar[h,'key',EXG2ANTTLib_TLB.exBarWorkingCount];
		AddBar(h,'Task','1/5/2001','1/5/2001','key',Null);
		ItemBar[h,'key',EXG2ANTTLib_TLB.exBarWorkingCount] := OleVariant(workingCount);
	end;
	EndUpdate();
end
|
|
1677
|
How can I programmatically move a bar, with a specified ammount (auto-adjust spans over a non-working period)
with G2antt1 do
begin
	BeginUpdate();
	with Chart do
	begin
		FirstVisibleDate := '1/1/2001';
		PaneWidth[False] := 64;
		with Bars do
		begin
			Item['Task'].Def[EXG2ANTTLib_TLB.exBarKeepWorkingCount] := OleVariant(True);
			Add('Task:Split').Shortcut := 'Task';
		end;
	end;
	Columns.Add('Column');
	with Items do
	begin
		h := AddItem('Original');
		AddBar(h,'Task','1/2/2001','1/5/2001','key',Null);
		h := AddItem('Moved');
		AddBar(h,'Task','1/2/2001','1/5/2001','key',Null);
		ItemBar[h,'key',EXG2ANTTLib_TLB.exBarMove] := OleVariant(3);
	end;
	EndUpdate();
end
|
|
1676
|
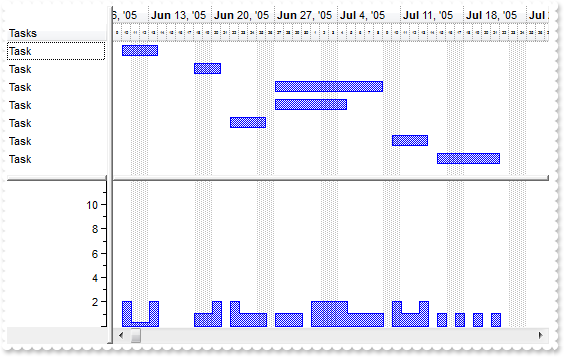
How can I show a secondary curve, line in the control's histogram
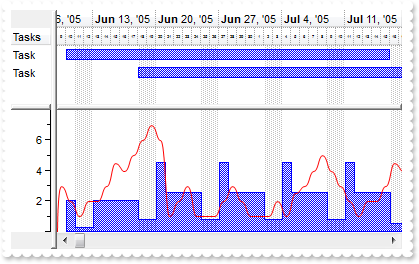
with G2antt1 do
begin
	BeginUpdate();
	Columns.Add('Tasks');
	AntiAliasing := True;
	with Chart do
	begin
		FirstWeekDay := EXG2ANTTLib_TLB.exMonday;
		LevelCount := 2;
		PaneWidth[False] := 40;
		FirstVisibleDate := '6/9/2005';
		HistogramVisible := True;
		HistogramView := Integer(EXG2ANTTLib_TLB.exHistogramNoGrouping) Or Integer(EXG2ANTTLib_TLB.exHistogramAllItems);
		HistogramHeight := 128;
		with Bars.Item['Task'] do
		begin
			HistogramPattern := Pattern;
			HistogramType := EXG2ANTTLib_TLB.exHistOverload;
			HistogramItems := 8;
			HistogramRulerLinesColor := $10000;
		end;
		Level[1].Label := '<font ;3><%d%>';
		UnitWidth := 9;
		with Bars.Item['Summary'] do
		begin
			HistogramPattern := EXG2ANTTLib_TLB.exRoundCurve;
			HistogramColor := $ff;
			HistogramType := EXG2ANTTLib_TLB.exHistOverload;
			HistogramItems := 8;
			HistogramBorderSize := 1;
		end;
	end;
	with Items do
	begin
		LockedItemCount[EXG2ANTTLib_TLB.exTop] := 1;
		h := LockedItem[EXG2ANTTLib_TLB.exTop,0];
		ItemHeight[h] := 0;
		AddBar(h,'Summary','1/1/2005','12/31/2005','1',Null);
		ItemBar[h,'1',EXG2ANTTLib_TLB.exBarEffort] := '(value mod 31) array (1,1,1,2,1,2.5,3,4,5,4,3,2,1,2,2,3,4.5,4,5,6,7,6,1,2,3,1,1,1,2,3,2,2)';
		h := AddItem('Task');
		AddBar(h,'Task','6/10/2005','7/16/2005','',Null);
		ItemBar[h,'',EXG2ANTTLib_TLB.exBarEffort] := 'weekday(value) in (0,6) ? 0.25 : 2';
		h := AddItem('Task');
		AddBar(h,'Task','6/18/2005','7/21/2005','',Null);
		ItemBar[h,'',EXG2ANTTLib_TLB.exBarEffort] := 'weekday(value) = 1 ? 2.5 : .5';
	end;
	EndUpdate();
end
|
|
1675
|
How can I add an owner-draw bar
// AfterDrawPart event - Occurs right after drawing the part of the control.
procedure TForm1.G2antt1AfterDrawPart(ASender: TObject; Part : DrawPartEnum; hDC : Integer; X : Integer; Y : Integer; Width : Integer; Height : Integer);
begin
	with G2antt1 do
	begin
		OutputDebugString( 'AfterDrawPart' );
		OutputDebugString( Part );
		OutputDebugString( Items.CellCaption[OleVariant(G2antt1.DrawPartItem),OleVariant(0)] );
		OutputDebugString( G2antt1.DrawPartKey );
	end
end;

// BeforeDrawPart event - Occurs just before drawing a part of the control.
procedure TForm1.G2antt1BeforeDrawPart(ASender: TObject; Part : DrawPartEnum; hDC : Integer; var X : Integer; var Y : Integer; var Width : Integer; var Height : Integer; var Cancel : WordBool);
begin
	with G2antt1 do
	begin
		Cancel := True;
		OutputDebugString( 'BeforeDrawPart' );
		OutputDebugString( Part );
		OutputDebugString( Items.CellCaption[OleVariant(G2antt1.DrawPartItem),OleVariant(0)] );
		OutputDebugString( G2antt1.DrawPartKey );
	end
end;

with G2antt1 do
begin
	BeginUpdate();
	Columns.Add('Task');
	with Chart do
	begin
		FirstVisibleDate := '1/1/2001';
		PaneWidth[False] := 128;
		LevelCount := 2;
		Bars.Add('OwnerDraw');
	end;
	with Items do
	begin
		AddBar(AddItem('Draw-Item-Bar-1'),'OwnerDraw','1/2/2001','1/5/2001','K1',Null);
		AddBar(AddItem('Draw-Item-Bar-2'),'OwnerDraw','1/6/2001','1/9/2001','K1',Null);
		ItemBar[0,'<*>',EXG2ANTTLib_TLB.exBarSelected] := OleVariant(True);
	end;
	EndUpdate();
end
|
|
1674
|
Is it possible to show a status left or right to the bar (method 2, exBarFrameColor, EBN)
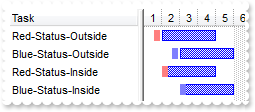
with G2antt1 do
begin
	BeginUpdate();
	with VisualAppearance do
	begin
		Add(2,'gBFLBCJwBAEHhEJAAChABP0IQAAYAQGKIaBoAKBQAGaAoDDYMQyQwAAxDOKsEwsACEIrjKCRShyCYZRrGUQyAKESRAGyTJBlKKodgOLYYSrFcgSIAsEhqGASRZGUBIJD' +
	'EMI4AJPIwxNIDfyNGKWI6gOQKIoSCYlU7IED0fQNGxVF6XaYqYAIRDINQlVzXcQzPYEbRxCKLKppWqIfpuSIBgI=');
		Add(1,'CP:2 -8 -1 0 0');
		Add(3,'CP:2 0 -1 0 0');
	end;
	Columns.Add('Task');
	with Chart do
	begin
		FirstVisibleDate := '1/1/2001';
		PaneWidth[False] := 128;
	end;
	with Items do
	begin
		h := AddItem('Red-Status-Outside');
		AddBar(h,'Task','1/2/2001','1/5/2001','K1',Null);
		ItemBar[h,'K1',EXG2ANTTLib_TLB.exBarFrameColor] := OleVariant(16777471);
		h := AddItem('Blue-Status-Outside');
		AddBar(h,'Task','1/3/2001','1/6/2001','K1',Null);
		ItemBar[h,'K1',EXG2ANTTLib_TLB.exBarFrameColor] := OleVariant(33488896);
		h := AddItem('Red-Status-Inside');
		AddBar(h,'Task','1/2/2001','1/5/2001','K1',Null);
		ItemBar[h,'K1',EXG2ANTTLib_TLB.exBarFrameColor] := OleVariant(50331903);
		h := AddItem('Blue-Status-Inside');
		AddBar(h,'Task','1/3/2001','1/6/2001','K1',Null);
		ItemBar[h,'K1',EXG2ANTTLib_TLB.exBarFrameColor] := OleVariant(67043328);
	end;
	EndUpdate();
end
|
|
1673
|
Is it possible to show a status left or right to the bar (method 1, exBarBackgroundExt)
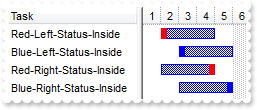
with G2antt1 do
begin
	BeginUpdate();
	Columns.Add('Task');
	with Chart do
	begin
		FirstVisibleDate := '1/1/2001';
		PaneWidth[False] := 128;
	end;
	with Items do
	begin
		h := AddItem('Red-Left-Status-Inside');
		AddBar(h,'Task','1/2/2001','1/5/2001','K1',Null);
		ItemBar[h,'K1',EXG2ANTTLib_TLB.exBarBackgroundExt] := 'left[6,back=RGB(255,0,0)]';
		h := AddItem('Blue-Left-Status-Inside');
		AddBar(h,'Task','1/3/2001','1/6/2001','K1',Null);
		ItemBar[h,'K1',EXG2ANTTLib_TLB.exBarBackgroundExt] := 'left[6,back=RGB(0,0,255)]';
		h := AddItem('Red-Right-Status-Inside');
		AddBar(h,'Task','1/2/2001','1/5/2001','K1',Null);
		ItemBar[h,'K1',EXG2ANTTLib_TLB.exBarBackgroundExt] := 'right[6,back=RGB(255,0,0)]';
		h := AddItem('Blue-Right-Status-Inside');
		AddBar(h,'Task','1/3/2001','1/6/2001','K1',Null);
		ItemBar[h,'K1',EXG2ANTTLib_TLB.exBarBackgroundExt] := 'right[6,back=RGB(0,0,255)]';
	end;
	EndUpdate();
end
|
|
1672
|
How can I use the ItemBar(exBarBackgroundExt) property for a bar
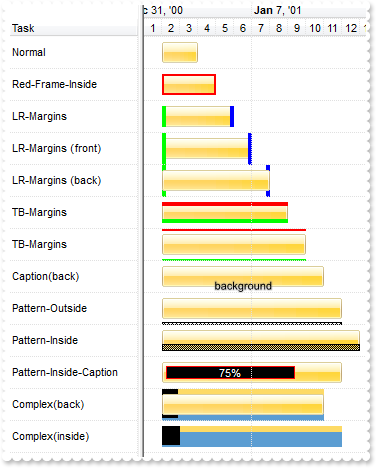
with G2antt1 do
begin
	BeginUpdate();
	DefaultItemHeight := 31;
	DrawGridLines := EXG2ANTTLib_TLB.exAllLines;
	GridLineColor := RGB(224,224,224);
	BackColorLevelHeader := BackColor;
	Columns.Add('Task');
	with Chart do
	begin
		LevelCount := 2;
		Level[0].GridLineColor := G2antt1.GridLineColor;
		Level[1].GridLineColor := G2antt1.GridLineColor;
		ShowNonworkingDates := False;
		FirstVisibleDate := '1/1/2001';
		PaneWidth[False] := 128;
		Bars.Item['Task'].Height := 21;
		DrawGridLines := EXG2ANTTLib_TLB.exAllLines;
	end;
	with Items do
	begin
		h := AddItem('Normal');
		AddBar(h,'Task','1/2/2001','1/4/2001','K1',Null);
		h := AddItem('Red-Frame-Inside');
		AddBar(h,'Task','1/2/2001','1/5/2001','K1',Null);
		ItemBar[h,'K1',EXG2ANTTLib_TLB.exBarBackgroundExt] := '[frame=RGB(255,0,0),framethick]';
		h := AddItem('LR-Margins');
		AddBar(h,'Task','1/2/2001','1/6/2001','K1',Null);
		ItemBar[h,'K1',EXG2ANTTLib_TLB.exBarBackgroundExt] := 'left[4,back=RGB(0,255,0)],right[4,back=RGB(0,0,255)]';
		h := AddItem('LR-Margins (front)');
		AddBar(h,'Task','1/2/2001','1/7/2001','K1',Null);
		ItemBar[h,'K1',EXG2ANTTLib_TLB.exBarBackgroundExt] := 'left[4,back=RGB(0,255,0)],right[4,back=RGB(0,0,255)]';
		ItemBar[h,'K1',EXG2ANTTLib_TLB.exBarBackgroundExtFlags] := OleVariant(2);
		h := AddItem('LR-Margins (back)');
		AddBar(h,'Task','1/2/2001','1/8/2001','K1',Null);
		ItemBar[h,'K1',EXG2ANTTLib_TLB.exBarBackgroundExt] := 'left[4,back=RGB(0,255,0)],right[4,back=RGB(0,0,255)]';
		ItemBar[h,'K1',EXG2ANTTLib_TLB.exBarBackgroundExtFlags] := OleVariant(3);
		h := AddItem('TB-Margins');
		AddBar(h,'Task','1/2/2001','1/9/2001','K1',Null);
		ItemBar[h,'K1',EXG2ANTTLib_TLB.exBarBackgroundExt] := 'top[4,back=RGB(255,0,0)],bottom[4,back=RGB(0,255,0)]';
		h := AddItem('TB-Margins');
		AddBar(h,'Task','1/2/2001','1/10/2001','K1',Null);
		ItemBar[h,'K1',EXG2ANTTLib_TLB.exBarBackgroundExt] := 'top[2,back=RGB(255,0,0)],bottom[2,back=RGB(0,255,0)]';
		ItemBar[h,'K1',EXG2ANTTLib_TLB.exBarBackgroundExtFlags] := OleVariant(2);
		h := AddItem('Caption(back)');
		AddBar(h,'Task','1/2/2001','1/11/2001','K1',Null);
		ItemBar[h,'K1',EXG2ANTTLib_TLB.exBarBackgroundExt] := 'client(bottom[14,text=`<sha ;;0><font ;8>background`,align=0x11])';
		ItemBar[h,'K1',EXG2ANTTLib_TLB.exBarBackgroundExtFlags] := OleVariant(2);
		h := AddItem('Pattern-Outside');
		AddBar(h,'Task','1/2/2001','1/12/2001','K1',Null);
		ItemBar[h,'K1',EXG2ANTTLib_TLB.exBarBackgroundExt] := 'bottom[10%,pattern=7,frame]';
		ItemBar[h,'K1',EXG2ANTTLib_TLB.exBarBackgroundExtFlags] := OleVariant(2);
		h := AddItem('Pattern-Inside');
		AddBar(h,'Task','1/2/2001','1/13/2001','K1',Null);
		ItemBar[h,'K1',EXG2ANTTLib_TLB.exBarBackgroundExt] := 'bottom[7,pattern=3,frame]';
		h := AddItem('Pattern-Inside-Caption');
		AddBar(h,'Task','1/2/2001','1/12/2001','K1',Null);
		ItemBar[h,'K1',EXG2ANTTLib_TLB.exBarBackgroundExt] := 'top[4](left[4],right[4],client),bottom[4](left[4],right[4],client),left[4],right[4],client(left[75%,text=`<fgcolor FFFFFF>75%`,a' +
	'lign=0x11,pattern=0x001,frame=RGB(255,0,0)])';
		h := AddItem('Complex(back)');
		AddBar(h,'Task','1/2/2001','1/11/2001','K1',Null);
		ItemBar[h,'K1',EXG2ANTTLib_TLB.exBarBackgroundExt] := 'top[30%,back=RGB(253,218,101)],client[back=RGB(91,157,210)],none[(0%,0%,10%,100%)](top[90%,back=RGB(0,0,0)])';
		ItemBar[h,'K1',EXG2ANTTLib_TLB.exBarBackgroundExtFlags] := OleVariant(3);
		h := AddItem('Complex(inside)');
		AddBar(h,'Task','1/2/2001','1/12/2001','K1',Null);
		ItemBar[h,'K1',EXG2ANTTLib_TLB.exBarBackgroundExt] := 'top[30%,back=RGB(253,218,101)],client[back=RGB(91,157,210)],none[(0%,0%,10%,100%)](top[90%,back=RGB(0,0,0)])';
	end;
	EndUpdate();
end
|
|
1671
|
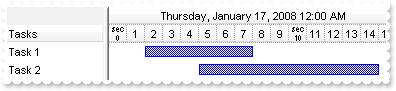
How can display seconds
with G2antt1 do
begin
	with Chart do
	begin
		PaneWidth[False] := 96;
		FirstVisibleDate := '1/17/2008';
		LevelCount := 2;
		UnitScale := EXG2ANTTLib_TLB.exSecond;
		Level[0].Alignment := Integer(EXG2ANTTLib_TLB.exHOutside) Or Integer(EXG2ANTTLib_TLB.CenterAlignment);
		Level[1].FormatLabel := '(0:=sec(dvalue)) mod 10 ? 0=: : ''<c><font ;6>sec<br><b>'' + 0=:';
	end;
	Columns.Add('Tasks');
	with Items do
	begin
		AddBar(AddItem('Task 1'),'Task','1/17/2008 12:00:02 AM','1/17/2008 12:00:08 AM',Null,Null);
		AddBar(AddItem('Task 2'),'Task','1/17/2008 12:00:05 AM','1/17/2008 12:00:15 AM',Null,Null);
	end;
end
|
|
1670
|
How can I check if an item contains a bar
// SelectionChanged event - Fired after a new item has been selected.
procedure TForm1.G2antt1SelectionChanged(ASender: TObject; );
begin
	with G2antt1 do
	begin
		with Items do
		begin
			OutputDebugString( 'Count of A: ' );
			OutputDebugString( ItemBar[FocusItem,'A',EXG2ANTTLib_TLB.exBarsCount] );
			OutputDebugString( 'Count of B: ' );
			OutputDebugString( ItemBar[FocusItem,'B',EXG2ANTTLib_TLB.exBarsCount] );
			OutputDebugString( 'Count of C: ' );
			OutputDebugString( ItemBar[FocusItem,'C',EXG2ANTTLib_TLB.exBarsCount] );
		end;
	end
end;

with G2antt1 do
begin
	BeginUpdate();
	Columns.Add('Task');
	with Chart do
	begin
		LevelCount := 2;
		FirstVisibleDate := '1/1/2001';
		PaneWidth[False] := 48;
		Bars.Item['Task'].Def[EXG2ANTTLib_TLB.exBarHAlignCaption] := OleVariant(18);
	end;
	with Items do
	begin
		AddBar(AddItem('Task'),'Task','1/2/2001','1/4/2001','A','A');
		AddBar(AddItem('Task'),'Task','1/2/2001','1/4/2001','B','B');
		AddBar(AddItem('Task'),'Task','1/2/2001','1/4/2001','C','C');
	end;
	EndUpdate();
end
|
|
1669
|
How can I connect to a DBF file
with G2antt1 do
begin
	BeginUpdate();
	ColumnAutoResize := False;
	ContinueColumnScroll := False;
	rs := (IUnknown(ComObj.CreateComObject(ComObj.ProgIDToClassID('ADODB.Recordset'))) as ADODB_TLB.Recordset);
	with rs do
	begin
		Open('Select * From foxcode.DBF','Provider=vfpoledb;Data Source=C:\Program Files\Microsoft Visual FoxPro 9\',3,3,Null);
	end;
	DataSource := (IUnknown(rs) as ADODB_TLB.Recordset);
	Chart.PaneWidth[True] := 0;
	EndUpdate();
end
|
|
1668
|
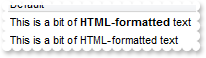
How do I get the caption with no HTML format
with G2antt1 do
begin
	Columns.Add('Default');
	with Items do
	begin
		h := AddItem('This is a bit of <b>HTML-formatted</b> text');
		CellValueFormat[OleVariant(h),OleVariant(0)] := EXG2ANTTLib_TLB.exHTML;
		AddItem(OleVariant(CellCaption[OleVariant(h),OleVariant(0)]));
	end;
end
|
|
1667
|
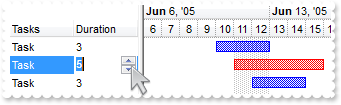
How can I change the bar's color based on its length/duration
with G2antt1 do
begin
	BeginUpdate();
	with Columns do
	begin
		Add('Tasks');
		with (IUnknown(Add('Duration')) as EXG2ANTTLib_TLB.Column) do
		begin
			Def[EXG2ANTTLib_TLB.exCellValueToItemBarProperty] := OleVariant(513);
			Editor.EditType := EXG2ANTTLib_TLB.SpinType;
		end;
	end;
	Items.AllowCellValueToItemBar := True;
	with Chart do
	begin
		FirstWeekDay := EXG2ANTTLib_TLB.exMonday;
		LevelCount := 2;
		FirstVisibleDate := '6/6/2005';
		PaneWidth[False] := 128;
	end;
	with ConditionalFormats.Add('%1 >= 4',Null) do
	begin
		ApplyTo := EXG2ANTTLib_TLB.FormatApplyToEnum($1);
		Bold := True;
		ApplyToBars := 'Task';
		BarColor := $ff;
		ForeColor := BarColor;
	end;
	with Items do
	begin
		AddBar(AddItem('Task'),'Task','6/10/2005','6/13/2005','',Null);
		AddBar(AddItem('Task'),'Task','6/11/2005','6/16/2005','',Null);
		AddBar(AddItem('Task'),'Task','6/12/2005','6/15/2005','',Null);
	end;
	EndUpdate();
end
|
|
1666
|
Is it possible to colorize the bars based on its starting/ending date
with G2antt1 do
begin
	BeginUpdate();
	OnResizeControl := Integer(EXG2ANTTLib_TLB.exDisableSplitter) Or Integer(EXG2ANTTLib_TLB.exResizeChart);
	with Columns do
	begin
		Add('Tasks');
		with (IUnknown(Add('Start')) as EXG2ANTTLib_TLB.Column) do
		begin
			Def[EXG2ANTTLib_TLB.exCellValueToItemBarProperty] := OleVariant(1);
			Visible := False;
		end;
	end;
	Items.AllowCellValueToItemBar := True;
	with Chart do
	begin
		FirstWeekDay := EXG2ANTTLib_TLB.exMonday;
		LevelCount := 2;
		FirstVisibleDate := '5/31/2005';
		PaneWidth[False] := 0;
		AllowInsideZoom := True;
		AllowResizeInsideZoom := False;
		InsideZoomOnDblClick := False;
		with DefaultInsideZoomFormat do
		begin
			PatternChart := EXG2ANTTLib_TLB.exPatternBDiagonal;
			PatternColorChart := $ff;
			ForeColor := PatternColorChart;
		end;
		with InsideZooms do
		begin
			SplitBaseLevel := False;
			DefaultWidth := 18;
			Add('6/10/2005').AllowInsideFormat := False;
		end;
	end;
	with ConditionalFormats.Add('%1 <= #6/10/2005#',Null) do
	begin
		ApplyToBars := 'Task';
		BarColor := $ff;
	end;
	with Items do
	begin
		AddBar(AddItem('Task'),'Task','6/10/2005','6/14/2005','',Null);
		AddBar(AddItem('Task'),'Task','6/11/2005','6/15/2005','',Null);
		AddBar(AddItem('Task'),'Task','6/12/2005','6/16/2005','',Null);
	end;
	EndUpdate();
end
|
|
1665
|
How can I change the bar's color based on values on the columns
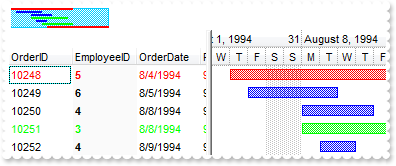
// AddItem event - Occurs after a new Item has been inserted to Items collection.
procedure TForm1.G2antt1AddItem(ASender: TObject; Item : HITEM);
begin
	with G2antt1 do
	begin
		with Items do
		begin
			AddBar(Item,'Task',CellValue[OleVariant(Item),OleVariant(2)],CellValue[OleVariant(Item),OleVariant(4)],Null,Null);
		end;
	end
end;

with G2antt1 do
begin
	BeginUpdate();
	with Chart do
	begin
		FirstVisibleDate := '8/3/1994';
		PaneWidth[False] := 256;
		LevelCount := 2;
		UnitScale := EXG2ANTTLib_TLB.exDay;
		FirstWeekDay := EXG2ANTTLib_TLB.exMonday;
		OverviewVisible := EXG2ANTTLib_TLB.exOverviewShowAllVisible;
	end;
	ColumnAutoResize := False;
	ContinueColumnScroll := False;
	rs := (IUnknown(ComObj.CreateComObject(ComObj.ProgIDToClassID('ADOR.Recordset'))) as ADODB_TLB.Recordset);
	with rs do
	begin
		Open('Orders','Provider=Microsoft.ACE.OLEDB.12.0;Data Source=C:\Program Files\Exontrol\ExG2antt\Sample\Access\misc.accdb',3,3,Null);
	end;
	DataSource := (IUnknown(rs) as ADODB_TLB.Recordset);
	Items.AllowCellValueToItemBar := True;
	Columns.Item[OleVariant(2)].Def[EXG2ANTTLib_TLB.exCellValueToItemBarProperty] := OleVariant(1);
	Columns.Item[OleVariant(4)].Def[EXG2ANTTLib_TLB.exCellValueToItemBarProperty] := OleVariant(2);
	with ConditionalFormats do
	begin
		with Add('1',Null) do
		begin
			ApplyTo := EXG2ANTTLib_TLB.FormatApplyToEnum($1);
			Bold := True;
			BackColor := $fafafa;
		end;
		with Add('%1 = 5',Null) do
		begin
			ApplyToBars := 'Task';
			BarColor := $ff;
			ForeColor := $ff;
			BarOverviewColor := $ff;
		end;
		with Add('%1 = 3',Null) do
		begin
			ApplyToBars := 'Task';
			BarColor := $ff00;
			ForeColor := $ff00;
			BarOverviewColor := $ff00;
		end;
	end;
	EndUpdate();
end
|
|
1664
|
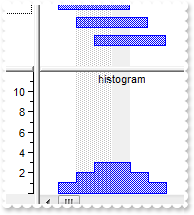
How can I display / specify a fixed percent for the task in the histogram, no matter how long the task is
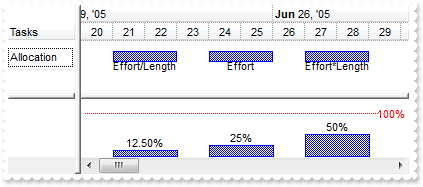
with G2antt1 do
begin
	BeginUpdate();
	DefaultItemHeight := 32;
	Columns.Add('Tasks');
	with Chart do
	begin
		UnitWidth := 32;
		LevelCount := 2;
		NonworkingDays := 0;
		PaneWidth[False] := 64;
		FirstVisibleDate := '6/20/2005';
		HistogramVisible := True;
		HistogramView := EXG2ANTTLib_TLB.exHistogramAllItems;
		HistogramHeight := 64;
		with Bars.Item['Task'] do
		begin
			HistogramPattern := Pattern;
			HistogramType := EXG2ANTTLib_TLB.exHistOverAllocation;
			ShowHistogramValues := 1;
		end;
		with Bars.Copy('Task','TaskFixed') do
		begin
			HistogramType := Integer(EXG2ANTTLib_TLB.exHistOverAllocationFixed) Or Integer(EXG2ANTTLib_TLB.exHistOverAllocation);
			ShowHistogramValues := 1;
		end;
		with Bars.Copy('Task','TaskMultiply') do
		begin
			HistogramType := Integer(EXG2ANTTLib_TLB.exHistOverAllocationMultiply) Or Integer(EXG2ANTTLib_TLB.exHistOverAllocation);
			ShowHistogramValues := 1;
		end;
	end;
	with Items do
	begin
		h := AddItem('Allocation');
		AddBar(h,'Task','6/21/2005','6/23/2005','A','Effort/Length');
		ItemBar[h,'A',EXG2ANTTLib_TLB.exBarEffort] := OleVariant(0.25);
		ItemBar[h,'A',EXG2ANTTLib_TLB.exBarVAlignCaption] := OleVariant(18);
		AddBar(h,'TaskFixed','6/24/2005','6/26/2005','B','Effort');
		ItemBar[h,'B',EXG2ANTTLib_TLB.exBarEffort] := OleVariant(0.25);
		ItemBar[h,'B',EXG2ANTTLib_TLB.exBarVAlignCaption] := OleVariant(18);
		AddBar(h,'TaskMultiply','6/27/2005','6/29/2005','C','Effort*Length');
		ItemBar[h,'C',EXG2ANTTLib_TLB.exBarEffort] := OleVariant(0.25);
		ItemBar[h,'C',EXG2ANTTLib_TLB.exBarVAlignCaption] := OleVariant(18);
	end;
	EndUpdate();
end
|
|
1663
|
Does your control supports scrolling by touching the screen
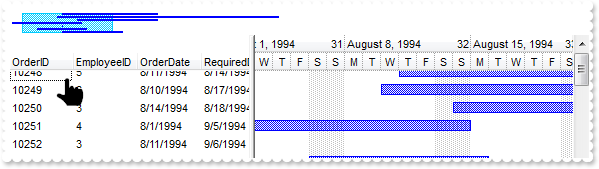
// AddItem event - Occurs after a new Item has been inserted to Items collection.
procedure TForm1.G2antt1AddItem(ASender: TObject; Item : HITEM);
begin
	with G2antt1 do
	begin
		with Items do
		begin
			AddBar(Item,'Task',CellValue[OleVariant(Item),OleVariant(2)],CellValue[OleVariant(Item),OleVariant(4)],Null,Null);
		end;
	end
end;

with G2antt1 do
begin
	BeginUpdate();
	with Chart do
	begin
		FirstVisibleDate := '8/3/1994';
		PaneWidth[False] := 256;
		LevelCount := 2;
		UnitScale := EXG2ANTTLib_TLB.exDay;
		FirstWeekDay := EXG2ANTTLib_TLB.exMonday;
		OverviewVisible := EXG2ANTTLib_TLB.exOverviewShowAllVisible;
	end;
	ColumnAutoResize := False;
	ContinueColumnScroll := False;
	rs := (IUnknown(ComObj.CreateComObject(ComObj.ProgIDToClassID('ADOR.Recordset'))) as ADODB_TLB.Recordset);
	with rs do
	begin
		Open('Orders','Provider=Microsoft.ACE.OLEDB.12.0;Data Source=C:\Program Files\Exontrol\ExG2antt\Sample\Access\misc.accdb',3,3,Null);
	end;
	DataSource := (IUnknown(rs) as ADODB_TLB.Recordset);
	Items.AllowCellValueToItemBar := True;
	Columns.Item[OleVariant(2)].Def[EXG2ANTTLib_TLB.exCellValueToItemBarProperty] := OleVariant(1);
	Columns.Item[OleVariant(4)].Def[EXG2ANTTLib_TLB.exCellValueToItemBarProperty] := OleVariant(2);
	ContinueColumnScroll := True;
	ScrollBySingleLine := True;
	Chart.AllowCreateBar := EXG2ANTTLib_TLB.exNoCreateBar;
	AutoDrag := Integer(EXG2ANTTLib_TLB.exAutoDragScrollOnShortTouch) Or Integer(EXG2ANTTLib_TLB.exAutoDragScroll);
	EndUpdate();
end
|
|
1662
|
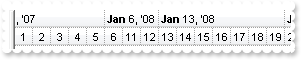
Is it possible to use build-in zoom-functionality to zoom time periods spanning to just some hours of one day (zoom-onfly)
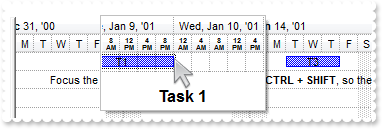
with G2antt1 do
begin
	BeginUpdate();
	Columns.Add('Task');
	with Chart do
	begin
		UnitScale := EXG2ANTTLib_TLB.exDay;
		PaneWidth[False] := 0;
		LevelCount := 2;
		FirstVisibleDate := '1/1/2001';
		DrawGridLines := EXG2ANTTLib_TLB.exAllLines;
		AllowZoomOnFly := EXG2ANTTLib_TLB.exZoomOnFly;
		ResizeUnitScale := EXG2ANTTLib_TLB.exHour;
		ResizeUnitCount := 4;
		Label[EXG2ANTTLib_TLB.exHour] := '<font ;5><b><%h%><br><%AM/PM%></b></font><||>4<||>65536';
		ZoomOnFlyCaption := '<br><c><b><font ;12><%=%C0%>';
	end;
	with Items do
	begin
		h := AddItem('Task 1');
		AddBar(h,'Task','1/7/2001','1/10/2001','T1','T1');
		AddBar(h,'Task','1/11/2001','1/14/2001','T3','T3');
		h := AddItem(Null);
		AddBar(h,'','1/15/2001','1/15/2001','','Focus the chart ( click here ), and press the <b>CTRL + SHIFT</b>, so the Zoom-OnFly is shown.');
		SelectableItem[h] := False;
	end;
	EndUpdate();
end
|
|
1661
|
Is it possible to use build-in zoom-functionality to zoom time periods spanning to just some hours of one day (inside-zoom)
with G2antt1 do
begin
	BeginUpdate();
	with Chart do
	begin
		UnitScale := EXG2ANTTLib_TLB.exDay;
		PaneWidth[False] := 0;
		LevelCount := 2;
		FirstVisibleDate := '1/1/2008';
		with DefaultInsideZoomFormat do
		begin
			InsideLabel := '<%hh%>';
			InsideUnit := EXG2ANTTLib_TLB.exHour;
			InsideCount := 8;
		end;
		AllowInsideZoom := True;
		with InsideZooms do
		begin
			Add('1/4/2008');
		end;
		DrawGridLines := EXG2ANTTLib_TLB.exAllLines;
	end;
	EndUpdate();
end
|
|
1660
|
How can I export the control's content to a PDF document (method 1)
with G2antt1 do
begin
	BeginUpdate();
	MarkSearchColumn := False;
	with Columns do
	begin
		Add('Tasks');
		with (IUnknown(Add('Start')) as EXG2ANTTLib_TLB.Column) do
		begin
			Def[EXG2ANTTLib_TLB.exCellValueToItemBarProperty] := OleVariant(1);
			Editor.EditType := EXG2ANTTLib_TLB.SpinType;
		end;
		with (IUnknown(Add('End')) as EXG2ANTTLib_TLB.Column) do
		begin
			Def[EXG2ANTTLib_TLB.exCellValueToItemBarProperty] := OleVariant(2);
			Editor.EditType := EXG2ANTTLib_TLB.SpinType;
		end;
	end;
	with Chart do
	begin
		PaneWidth[False] := 196;
		LevelCount := 2;
		ShowEmptyBars := 1;
		FirstVisibleDate := '1/1/2009';
	end;
	with Items do
	begin
		AllowCellValueToItemBar := True;
		AddBar(AddItem('Task 1'),'Task','1/2/2009','1/7/2009',Null,Null);
		AddBar(AddItem('Task 2'),'Task','1/4/2009','1/9/2009',Null,Null);
	end;
	with (IUnknown(ComObj.CreateComObject(ComObj.ProgIDToClassID('Exontrol.Print'))) as EXPRINTLib_TLB.Print) do
	begin
		PrintExt := (IUnknown(G2antt1.DefaultInterface) as EXG2ANTTLib_TLB.G2antt);
		CopyTo('c:/temp/xtest.pdf');
	end;
	OutputDebugString( 'Look for C:\Temp\xtest.pdf file.' );
	EndUpdate();
end
|
|
1659
|
How can I export the control's content to a PDF document (method 2)
with G2antt1 do
begin
	BeginUpdate();
	MarkSearchColumn := False;
	with Columns do
	begin
		Add('Tasks');
		with (IUnknown(Add('Start')) as EXG2ANTTLib_TLB.Column) do
		begin
			Def[EXG2ANTTLib_TLB.exCellValueToItemBarProperty] := OleVariant(1);
			Editor.EditType := EXG2ANTTLib_TLB.SpinType;
		end;
		with (IUnknown(Add('End')) as EXG2ANTTLib_TLB.Column) do
		begin
			Def[EXG2ANTTLib_TLB.exCellValueToItemBarProperty] := OleVariant(2);
			Editor.EditType := EXG2ANTTLib_TLB.SpinType;
		end;
	end;
	with Chart do
	begin
		PaneWidth[False] := 196;
		LevelCount := 2;
		ShowEmptyBars := 1;
		FirstVisibleDate := '1/1/2009';
	end;
	with Items do
	begin
		AllowCellValueToItemBar := True;
		AddBar(AddItem('Task 1'),'Task','1/2/2009','1/7/2009',Null,Null);
		AddBar(AddItem('Task 2'),'Task','1/4/2009','1/9/2009',Null,Null);
	end;
	var_CopyTo := CopyTo['c:/temp/xtest.pdf'];
	OutputDebugString( 'Look for C:\Temp\xtest.pdf file.' );
	EndUpdate();
end
|
|
1658
|
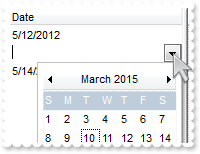
Today date is shown, if we use the Column.FormatColumn and Editor.Option(exDateAllowNullDate) properties. What can be done
with G2antt1 do
begin
	BeginUpdate();
	with (IUnknown(Columns.Add('Date')) as EXG2ANTTLib_TLB.Column) do
	begin
		FormatColumn := 'len(value) ? ( (longdate(date(value)) left 3) + '' '' + day(date(value)) + ''/'' + month(date(value)) + ''/'' + (year(date(value)) rig' +
	'ht 2) ) : '''' )';
		with Editor do
		begin
			EditType := EXG2ANTTLib_TLB.DateType;
			Option[EXG2ANTTLib_TLB.exDateAllowNullDate] := OleVariant(True);
		end;
	end;
	with Items do
	begin
		AddItem('5/12/2012');
		AddItem(Null);
		AddItem('5/14/2012');
	end;
	EndUpdate();
end
|
|
1657
|
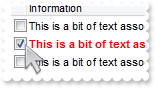
Is there a syntax for conditional formatting of items, based on CellState/CellStateChange
// CellStateChanged event - Fired after cell's state has been changed.
procedure TForm1.G2antt1CellStateChanged(ASender: TObject; Item : HITEM; ColIndex : Integer);
begin
	with G2antt1 do
	begin
		with Items do
		begin
			CellValue[OleVariant(Item),OleVariant(2)] := OleVariant(CellState[OleVariant(Item),OleVariant(0)]);
		end;
	end
end;

with G2antt1 do
begin
	BeginUpdate();
	ShowFocusRect := False;
	SelBackMode := EXG2ANTTLib_TLB.exTransparent;
	var_ConditionalFormat := ConditionalFormats.Add('%2 != 0',Null);
	with var_ConditionalFormat do
	begin
		Bold := True;
		ForeColor := $ff;
		ApplyTo := EXG2ANTTLib_TLB.exFormatToItems;
	end;
	with (IUnknown(Columns.Add('')) as EXG2ANTTLib_TLB.Column) do
	begin
		Def[EXG2ANTTLib_TLB.exCellHasCheckBox] := OleVariant(True);
		Width := 16;
		AllowSizing := False;
	end;
	Columns.Add('Information');
	(IUnknown(Columns.Add('Hidden')) as EXG2ANTTLib_TLB.Column).Visible := False;
	with Items do
	begin
		CellValue[OleVariant(AddItem('')),OleVariant(1)] := 'This is a bit of text associated';
		h := AddItem('');
		CellValue[OleVariant(h),OleVariant(1)] := 'This is a bit of text associated';
		CellState[OleVariant(h),OleVariant(0)] := 1;
		CellValue[OleVariant(AddItem('')),OleVariant(1)] := 'This is a bit of text associated';
	end;
	EndUpdate();
end
|
|
1656
|
How can I hide the items/grid section of the control
with G2antt1 do
begin
	BeginUpdate();
	OnResizeControl := Integer(EXG2ANTTLib_TLB.exDisableSplitter) Or Integer(EXG2ANTTLib_TLB.exResizeChart);
	Columns.Add('Tasks');
	with Chart do
	begin
		FirstWeekDay := EXG2ANTTLib_TLB.exMonday;
		LevelCount := 2;
		FirstVisibleDate := '6/9/2005';
		HistogramVisible := True;
		HistogramView := EXG2ANTTLib_TLB.exHistogramAllItems;
		HistogramHeight := 128;
		with Bars.Item['Task'] do
		begin
			HistogramPattern := Pattern;
		end;
		PaneWidth[False] := 0;
	end;
	with Items do
	begin
		AddBar(AddItem('Task'),'Task','6/10/2005','6/14/2005','',Null);
		AddBar(AddItem('Task'),'Task','6/11/2005','6/15/2005','',Null);
		AddBar(AddItem('Task'),'Task','6/12/2005','6/16/2005','',Null);
	end;
	EndUpdate();
end
|
|
1655
|
How can I draw an extra line which could indicate deadline for my tasks
with G2antt1 do
begin
	BeginUpdate();
	DefaultItemHeight := 24;
	with VisualAppearance do
	begin
		Add(2,'gBFLBCJwBAEHhEJAAChABLMIQAAYAQGKIaBoAKBQAGaAoDDQOQ4QwAAxjAKUEwsACEIrjKCYVgOHYYRrIIEvZAAMIlSbCMoxcAsSQSf6YJBmKL4fiWMobRCMQyiLLMdw' +
	'iGoYJ4hGgKChqI43RZNErURRkEwCgIA=');
		Add(1,'CP:2 0 -4 0 4');
	end;
	Columns.Add('Task');
	with Chart do
	begin
		FirstVisibleDate := '1/1/2001';
		PaneWidth[False] := 128;
	end;
	with Items do
	begin
		h := AddItem('Default');
		AddBar(h,'Task','1/2/2001','1/5/2001','K1',Null);
		ItemBar[h,'K1',EXG2ANTTLib_TLB.exBarFrameColor] := OleVariant(16777471);
		AddBar(h,'Task','1/9/2001','1/14/2001','K2',Null);
		ItemBar[h,'K2',EXG2ANTTLib_TLB.exBarFrameColor] := OleVariant(33488896);
	end;
	EndUpdate();
end
|
|
1654
|
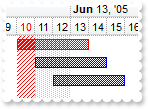
How can I mark/highlight a zone in the control's histogram
with G2antt1 do
begin
	BeginUpdate();
	Columns.Add('Tasks');
	with Chart do
	begin
		FirstWeekDay := EXG2ANTTLib_TLB.exMonday;
		LevelCount := 2;
		PaneWidth[False] := 40;
		FirstVisibleDate := '6/9/2005';
		HistogramVisible := True;
		HistogramView := EXG2ANTTLib_TLB.exHistogramAllItems;
		HistogramHeight := 128;
		with Bars.Item['Task'] do
		begin
			HistogramPattern := Pattern;
			HistogramType := EXG2ANTTLib_TLB.exHistOverload;
			HistogramItems := 12;
			HistogramRulerLinesColor := $10000;
		end;
	end;
	with Items do
	begin
		AddBar(AddItem('Task'),'Task','6/10/2005','6/14/2005','',Null);
		AddBar(AddItem('Task'),'Task','6/11/2005','6/15/2005','',Null);
		AddBar(AddItem('Task'),'Task','6/12/2005','6/16/2005','',Null);
	end;
	Chart.MarkTimeZone('zone','6/13/2005','6/14/2005',OleVariant(15790320),';;;;histogram;1');
	EndUpdate();
end
|
|
1653
|
How can I get the min/max values from the histogram
// MouseMove event - Occurs when the user moves the mouse.
procedure TForm1.G2antt1MouseMove(ASender: TObject; Button : Smallint; Shift : Smallint; X : Integer; Y : Integer);
begin
	with G2antt1 do
	begin
		with Chart do
		begin
			OutputDebugString( 'Value' );
			OutputDebugString( HistogramValue[OleVariant(DateFromPoint[-1,-1]),Null,Null] );
			OutputDebugString( 'MIN' );
			OutputDebugString( HistogramValue['min',Null,Null] );
			OutputDebugString( 'MAX' );
			OutputDebugString( HistogramValue['max',Null,Null] );
		end;
	end
end;

with G2antt1 do
begin
	BeginUpdate();
	Columns.Add('Tasks');
	with Chart do
	begin
		FirstWeekDay := EXG2ANTTLib_TLB.exMonday;
		LevelCount := 2;
		PaneWidth[False] := 40;
		FirstVisibleDate := '6/9/2005';
		HistogramVisible := True;
		HistogramView := EXG2ANTTLib_TLB.exHistogramAllItems;
		HistogramHeight := 128;
		with Bars.Item['Task'] do
		begin
			HistogramPattern := Pattern;
			HistogramType := EXG2ANTTLib_TLB.exHistOverload;
			HistogramItems := 12;
			HistogramRulerLinesColor := $10000;
		end;
	end;
	with Items do
	begin
		AddBar(AddItem('Task'),'Task','6/10/2005','6/14/2005','',Null);
		AddBar(AddItem('Task'),'Task','6/11/2005','6/15/2005','',Null);
		AddBar(AddItem('Task'),'Task','6/12/2005','6/16/2005','',Null);
	end;
	EndUpdate();
end
|
|
1652
|
How can I assign different efforts(expression) to the same bar
with G2antt1 do
begin
	BeginUpdate();
	Columns.Add('Tasks');
	with Chart do
	begin
		FirstWeekDay := EXG2ANTTLib_TLB.exMonday;
		LevelCount := 2;
		PaneWidth[False] := 40;
		FirstVisibleDate := '6/9/2005';
		HistogramVisible := True;
		HistogramView := EXG2ANTTLib_TLB.exHistogramAllItems;
		HistogramHeight := 128;
		with Bars.Item['Task'] do
		begin
			HistogramPattern := Pattern;
			HistogramType := EXG2ANTTLib_TLB.exHistOverload;
			HistogramItems := 12;
			HistogramRulerLinesColor := $10000;
		end;
		Level[1].Label := '<font ;3><%d%>';
		UnitWidth := 9;
	end;
	with Items do
	begin
		h := AddItem('Task');
		AddBar(h,'Task','6/10/2005','6/14/2005','',Null);
		ItemBar[h,'',EXG2ANTTLib_TLB.exBarEffort] := 'weekday(value) in (0,6) ? 0.25 : 2';
		h := AddItem('Task');
		AddBar(h,'Task','6/18/2005','6/21/2005','',Null);
		ItemBar[h,'',EXG2ANTTLib_TLB.exBarEffort] := 'weekday(value) = 1 ? 2 : 1';
		h := AddItem('Task');
		AddBar(h,'Task','6/27/2005','7/9/2005','',Null);
		ItemBar[h,'',EXG2ANTTLib_TLB.exBarEffort] := 'month (value) = 7 ? 1 : 0';
		h := AddItem('Task');
		AddBar(h,'Task','6/27/2005','7/5/2005','',Null);
		ItemBar[h,'',EXG2ANTTLib_TLB.exBarEffort] := '(month(value)=month(value+1)) ? 1 : 0';
		h := AddItem('Task');
		AddBar(h,'Task','6/22/2005','6/26/2005','',Null);
		ItemBar[h,'',EXG2ANTTLib_TLB.exBarEffort] := 'int(value-start) ? 1 : 2';
		h := AddItem('Task');
		AddBar(h,'Task','7/10/2005','7/14/2005','',Null);
		ItemBar[h,'',EXG2ANTTLib_TLB.exBarEffort] := '(int(value-start) and int(end-value) != 0 ) ? 1 : 2';
		h := AddItem('Task');
		AddBar(h,'Task','7/15/2005','7/22/2005','',Null);
		ItemBar[h,'',EXG2ANTTLib_TLB.exBarEffort] := '(int(value-start)+1) mod 2 ? 1 : 0';
	end;
	EndUpdate();
end
|
|
1651
|
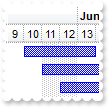
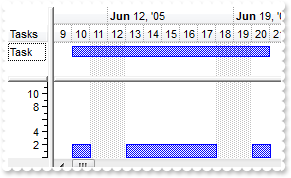
How can I prevent showing the representation of the bar on the week days, nonworking part
with G2antt1 do
begin
	BeginUpdate();
	Columns.Add('Tasks');
	with Chart do
	begin
		LevelCount := 2;
		PaneWidth[False] := 40;
		FirstVisibleDate := '6/9/2005';
		HistogramVisible := True;
		HistogramView := EXG2ANTTLib_TLB.exHistogramAllItems;
		HistogramHeight := 128;
		with Bars.Item['Task'] do
		begin
			HistogramPattern := Pattern;
			HistogramType := EXG2ANTTLib_TLB.exHistOverload;
			HistogramItems := 12;
			HistogramRulerLinesColor := $10000;
		end;
	end;
	with Items do
	begin
		h := AddItem('Task');
		AddBar(h,'Task','6/10/2005','6/21/2005','',Null);
		ItemBar[h,'',EXG2ANTTLib_TLB.exBarEffort] := 'weekday(value) in (0,6) ? 0 : 2';
	end;
	EndUpdate();
end
|
|
1650
|
How do I programatically focus a cell
// FocusChanged event - Occurs when a cell gets the focus.
procedure TForm1.G2antt1FocusChanged(ASender: TObject; );
begin
	with G2antt1 do
	begin
		with Items do
		begin
			CellBackColor[OleVariant(FocusItem),OleVariant(G2antt1.FocusColumnIndex)] := $ff;
		end;
	end
end;

with G2antt1 do
begin
	BeginUpdate();
	SelForeColor := ForeColor;
	SelBackColor := BackColor;
	DrawGridLines := EXG2ANTTLib_TLB.exRowLines;
	with Columns do
	begin
		Add('Column1');
		Add('Column2');
	end;
	with Items do
	begin
		CellValue[OleVariant(AddItem('Cell 1.1')),OleVariant(1)] := 'Cell 1.2';
		CellValue[OleVariant(AddItem('Cell 2.1')),OleVariant(1)] := 'Cell 2.2';
	end;
	with Items do
	begin
		SelectItem[ItemByIndex[1]] := True;
	end;
	FocusColumnIndex := 1;
	EndUpdate();
end
|
|
1649
|
How do I programatically focus a cell (excrd)
// FocusChanged event - Occurs when a cell gets the focus.
procedure TForm1.G2antt1FocusChanged(ASender: TObject; );
begin
	with G2antt1 do
	begin
		with Items do
		begin
			CellBackColor[OleVariant(FocusItem),OleVariant(G2antt1.FocusColumnIndex)] := $ff;
		end;
	end
end;

with G2antt1 do
begin
	BeginUpdate();
	SelForeColor := ForeColor;
	SelBackColor := BackColor;
	DrawGridLines := EXG2ANTTLib_TLB.exRowLines;
	DefaultItemHeight := 36;
	with Columns do
	begin
		(IUnknown(Add('Column1')) as EXG2ANTTLib_TLB.Column).Visible := False;
		(IUnknown(Add('Column2')) as EXG2ANTTLib_TLB.Column).Visible := False;
		(IUnknown(Add('Column3')) as EXG2ANTTLib_TLB.Column).Visible := False;
		with (IUnknown(Add('FormatLevel')) as EXG2ANTTLib_TLB.Column) do
		begin
			FormatLevel := '(0/1),2';
			Def[EXG2ANTTLib_TLB.exCellFormatLevel] := OleVariant(FormatLevel);
		end;
	end;
	with Items do
	begin
		h := AddItem('Cell 1.1');
		CellValue[OleVariant(h),OleVariant(1)] := 'Cell 1.2';
		CellValue[OleVariant(h),OleVariant(2)] := 'Cell 1.3';
		h := AddItem('Cell 2.1');
		CellValue[OleVariant(h),OleVariant(1)] := 'Cell 2.2';
		CellValue[OleVariant(h),OleVariant(2)] := 'Cell 2.3';
	end;
	with Items do
	begin
		SelectItem[ItemByIndex[1]] := True;
	end;
	FocusColumnIndex := 2;
	EndUpdate();
end
|
|
1648
|
How can I get task's user data ( exBarData ) when user double clicks the bar
// DblClick event - Occurs when the user dblclk the left mouse button over an object.
procedure TForm1.G2antt1DblClick(ASender: TObject; Shift : Smallint; X : Integer; Y : Integer);
begin
	with G2antt1 do
	begin
		item := ItemFromPoint[-1,-1,c,hit];
		key := Chart.BarFromPoint[-1,-1];
		OutputDebugString( Items.ItemBar[item,OleVariant(key),EXG2ANTTLib_TLB.exBarData] );
	end
end;

with G2antt1 do
begin
	BeginUpdate();
	Columns.Add('Task');
	Chart.FirstVisibleDate := '1/1/2001';
	Chart.PaneWidth[False] := 48;
	with Items do
	begin
		h := AddItem('Task 1');
		AddBar(h,'Task','1/2/2001','1/5/2001','',Null);
		ItemBar[h,'',EXG2ANTTLib_TLB.exBarData] := 'this is a bit of extra data associated with task 1';
		h := AddItem('Task 2');
		AddBar(h,'Task','1/2/2001','1/5/2001','',Null);
		ItemBar[h,'',EXG2ANTTLib_TLB.exBarData] := 'this is a bit of extra data associated with task 2';
	end;
	EndUpdate();
end
|
|
1647
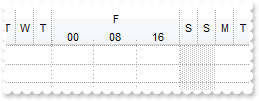
|
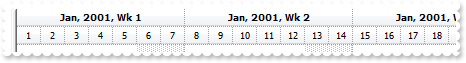
How do I get arranged the levels to display, weeks, days and so on
with G2antt1 do
begin
	BeginUpdate();
	with Chart do
	begin
		UnitWidth := 24;
		FirstVisibleDate := '1/1/2001';
		PaneWidth[False] := 0;
		LevelCount := 2;
		FirstWeekDay := EXG2ANTTLib_TLB.exMonday;
		with Level[0] do
		begin
			Alignment := EXG2ANTTLib_TLB.CenterAlignment;
			Label := '<b><Font Tahoma;7><%m3%>, <%yyyy%></b><b>, <Font Tahoma;7>Wk <%ww%>';
			Unit := EXG2ANTTLib_TLB.exWeek;
			DrawGridLines := True;
		end;
		with Level[1] do
		begin
			Alignment := EXG2ANTTLib_TLB.CenterAlignment;
			Label := '<Font Tahoma;7><%d%>';
			Unit := EXG2ANTTLib_TLB.exDay;
		end;
		DrawGridLines := EXG2ANTTLib_TLB.exAllLines;
	end;
	EndUpdate();
end
|
|
1646
|
How can I add a task and a milestone to the same item
with G2antt1 do
begin
	Columns.Add('Task');
	Chart.FirstVisibleDate := '1/1/2001';
	with Items do
	begin
		h := AddItem('Task 1');
		AddBar(h,'Milestone','1/2/2001','1/2/2001','MKey',Null);
		AddBar(h,'Task','1/3/2001','1/7/2001',Null,Null);
	end;
end
|
|
1645
|
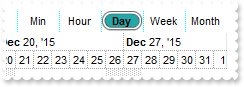
How can I change the visual appearance of the buttons on the control's overview part
with G2antt1 do
begin
	VisualAppearance.Add(1,'gBFLBCJwBAEHhEJAADhABdQFg6AADACAxRDAMgBQKAAzQFAYawdBgABoGUZ4JhUAIIRZGMIjFDcEwxC6NIpAWCYQDENQwSSMMJwSKYYBiASEYJASQZUhmHIDTbIEBxfI' +
	'MIRLE6PZbmEYYfgeNY6TQCcIgVD0ExhAZ2Q4EQAKRpOFY/DBQNLgAKNCQ3LaQY7BaKgZouTYDVrVNSVFC0IBkGoSbauCIJHrGCZ1RBYMI0VDNRwHJiMbRtSyqXjGJ4pS' +
	'rAcq0FAgYRHI6jZxnGL5chqPqGVjMNZ1bQuKwzT0Ld5wTYsdydBK1MIkTKKaoORZgRpYUI6FAeSgBWyPcCqPSoDrKdo4XLdYwbeAFcSPD6+NBhG7tXm/NarNTgTB6DBt' +
	'hsGJbgYYw9AQVxBoOch2hEbh+nAARYkQdZ7CMPYGH+FxmlqbJ5lqDAdjMC5AmIW54hwaBvA4IQ8D+T8IFscgenAAZMHiEgWiWdRZlSAAhAkFAGq6dAdEcIYVF4QJKCAH' +
	'QDBCBJYGUGQNhCEIhiSCJaGAYQWBsIYmEEFgJAGQ42CyC4iliPgygsT4olSXg3g2Qwwk0MpMiMLJIg8Y54niTYOmPPJMDMDIonSSU7jMJJbDaTYjlYUoMmMCRWFQAAlE' +
	'kZgtDgTgjgCJQpEoIgkgkIQHnIAB7CACARnIaIaiaGYuG6GxmhmFB7CGSICAyHwoAmQxQlQNIlikWgthYIwaAYVQvAuQpsg0IxIhKTIzCwToTiiaYACkChGhKJJpEOQo' +
	'WC+C5imyCgiggYpUzMZ5Yj6AIfg6UpcjgLYInIPILhOTYaEIUg9EoItfCGCByAiCV2lIKILCGK4qnKO4YggWpQgIJxJmIaJhDgDgKECaIykkUhUhILQLEKRh9iiYpzCS' +
	'SQxmgcgkm2NppAKbI8C4RoBiQYgSgSMQQEEEIDjECBDA8LorjKa47EQMQSm4DpEhEKBDBeRgBGqMQnmkA5in4JAJAINoEC6JR4jyaQ6E6AhEhIIxNBMRJPiQCYyHCGAU' +
	'gUMQwEgEhhkEOBHBOBJxCMHJHjGXB/CKSBxlENwaj1qgsEwERICIDB/iQDgjgiYYvE2cx8l2KIinoEI5CYSYiFqEAz0mMBZBbwIkEsEN+gMSpSHSTITEqSoEFyGBHCoS' +
	'oihqEAsgsIo8ikKhKGiVJ6AADwTkicQlAkUhElA+Z4VUHpHGuRA8lMdI9DscJc8r5QQAaIYsGUOpOjoOwHCEJAUgBh8B1EAAcHIzg5gPCGNgdQfRPhnGiLINhhQEDCBc' +
	'GUDYphxjLHkNgfwTARhiHEBYWAVxpI1HQDcDjthiAADoKcCgJgbs7FyG4LQagBBgE0CMOYOxLhtGY/AcAegNgTHIPkHISAHADEQNYOA2BwAHEQHABwQxMDbCQEscoEBA' +
	'AgEOD0V4cR0jyGCPAPwHAvh0EAOIHIDRfA/EaGMfYfguAACiBQIg/xWAbH0F8J4bxSD6G8MUMo7Q9ieHuI8eA0gLjfG2PUPQnwvhvHsPsGABxhD8E+AMbgfhVDJH2L8U' +
	'48wAjbEGPwPo7x8j4F4FccwHAhhiEgBQEQhAnCDGgHwBonxiAZD+G8Lo/hHj3H8PELIiBwgOFCNQHAqQAhYBWAUIARAECgHyKkIIqAIgGGCLgUIFAhB5CQAcFAGgcEHH' +
	'KBwUYkAdiHDgOaAIKBigYCCFAFQhBzChAWKEOYzwDhCEwFMBQNxwD3C8CsPgHQhANEuA4Uw+gdhHDAOwBogRYAzFuGAQIEgQAzCSGUAIbAXAFCiKIGghhBCQAeAFIgDg' +
	'wjMByEAAYXg1hiEwFgBYAQugAGIPsTodgnDSBgMca4LhqChCgD4CIYgYBDmcI4GIxgUCYAm1oPIjwgjmFQMYWA1gNCiBUqcII6gegUEAHwB4oRwhzEGLge4GAOC6HUAc' +
	'MIsAbCGDqLYHYVBACTAkIIIAYigCIGcBQCArQKiiFQFERQUQhDMAOBgcIWAggUBGIMfAVAHhCBwEgBAMg+jbFqCcHYLxvg4D2A8QI3AziMHiJoUgFhACyCwIINofwHiJ' +
	'DAJUKw2B2ARGEEAIwCxIh2BaNQQA/ROBRGoFYQ48B/AeEGEt99lQOgDFgGcAtFgdgHEANIMAhAIDKAygkQAEAAjxBeIoCI7QfjUEEEwDIIgWBFEQHUSANxsAqEEEUdwl' +
	'A4iJCSFYEwhBsCXE0KoIAexnj4DoDkEwaBmgYCGAwMADAkCFCMMYAQOgMhQEIHsaIVQQDXFOOgRtwAUguAcAUU1iw1CWA6OwdIOQFBxCgCkDgeBribBmIgP4KQiAAB+K' +
	'oAg2QNiDDoG0BQyQzg+EGOAWAFgRC4DsEURQYAdhWFKAoKAVQAB/AcHEaAORiioFqBYMWFATCZEsBsIYcA0gMGCJwGAhg4DQAwKsDAYQGzZBkAcSA8gODEBEGQVIQhaj' +
	'UEeeYKY1QIDrBCIAEg0xIAwEgBNkAAADUTA6B4MQEwv0UEGLAUgzhf04AKGEg4BhYD2B0MUAABApAAvqI8WAqAdDGGwJsEIXwWDtE0AAA4fhmDZCmJMMwbBkgBIC');
	with Chart do
	begin
		PaneWidth[False] := 0;
		LevelCount := 2;
		OverviewVisible := EXG2ANTTLib_TLB.exOverviewShowAllVisible;
		AllowOverviewZoom := EXG2ANTTLib_TLB.exAlwaysZoom;
		Label[EXG2ANTTLib_TLB.exSecond] := '';
		Label[EXG2ANTTLib_TLB.exYear] := '';
	end;
	Chart.OverviewSelBackColor := $1ffff00;
end
|
|
1644
|
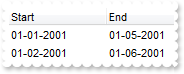
Is there a way to show the Start and End dates in mm-dd-yyyy format
with G2antt1 do
begin
	BeginUpdate();
	MarkSearchColumn := False;
	Items.AllowCellValueToItemBar := True;
	with Chart do
	begin
		LevelCount := 2;
		FirstVisibleDate := '12/25/2000';
		PaneWidth[False] := 196;
	end;
	with (IUnknown(Columns.Add('Start')) as EXG2ANTTLib_TLB.Column) do
	begin
		Def[EXG2ANTTLib_TLB.exCellValueToItemBarProperty] := OleVariant(1);
		Def[EXG2ANTTLib_TLB.exCellValueToItemBarKey] := 'K1';
		FormatColumn := '(0 array (0:=(shortdateF(value) split `/`))) + `-` + (1 array (=:0) ) + `-` + (2 array (=:0) )';
	end;
	with (IUnknown(Columns.Add('End')) as EXG2ANTTLib_TLB.Column) do
	begin
		Def[EXG2ANTTLib_TLB.exCellValueToItemBarProperty] := OleVariant(2);
		Def[EXG2ANTTLib_TLB.exCellValueToItemBarKey] := 'K1';
		FormatColumn := 'shortdateF(value) replace `/` with `-`';
	end;
	with Items do
	begin
		AddBar(AddItem(Null),'Task','1/1/2001','1/5/2001','K1',Null);
		AddBar(AddItem(Null),'Task','1/2/2001','1/6/2001','K1',Null);
	end;
	EndUpdate();
end
|
|
1643
|
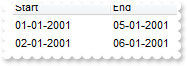
Is there a way to show the Start and End dates in dd-mm-yyyy format
with G2antt1 do
begin
	BeginUpdate();
	MarkSearchColumn := False;
	Items.AllowCellValueToItemBar := True;
	with Chart do
	begin
		LevelCount := 2;
		FirstVisibleDate := '12/25/2000';
		PaneWidth[False] := 196;
	end;
	with (IUnknown(Columns.Add('Start')) as EXG2ANTTLib_TLB.Column) do
	begin
		Def[EXG2ANTTLib_TLB.exCellValueToItemBarProperty] := OleVariant(1);
		Def[EXG2ANTTLib_TLB.exCellValueToItemBarKey] := 'K1';
		FormatColumn := '(1 array (0:=(shortdateF(value) split `/`))) + `-` + (0 array (=:0) ) + `-` + (2 array (=:0) )';
	end;
	with (IUnknown(Columns.Add('End')) as EXG2ANTTLib_TLB.Column) do
	begin
		Def[EXG2ANTTLib_TLB.exCellValueToItemBarProperty] := OleVariant(2);
		Def[EXG2ANTTLib_TLB.exCellValueToItemBarKey] := 'K1';
		FormatColumn := '(1 array (0:=(shortdateF(value) split `/`))) + `-` + (0 array (=:0) ) + `-` + (2 array (=:0) )';
	end;
	with Items do
	begin
		AddBar(AddItem(Null),'Task','1/1/2001','1/5/2001','K1',Null);
		AddBar(AddItem(Null),'Task','1/2/2001','1/6/2001','K1',Null);
	end;
	EndUpdate();
end
|
|
1642
|
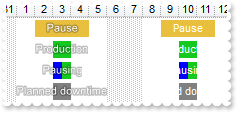
If we have bars with dark color, we use white font/color. But if the bars are too small for the caption, you can�t read it. What can we do
with G2antt1 do
begin
	BeginUpdate();
	Columns.Add('Task');
	Chart.FirstVisibleDate := '12/29/2000';
	Chart.PaneWidth[False] := 48;
	with Chart.Bars.Item['Task'] do
	begin
		Pattern := EXG2ANTTLib_TLB.exPatternSolid;
		Height := 17;
	end;
	with Chart.Bars.Item['Progress'] do
	begin
		Pattern := EXG2ANTTLib_TLB.exPatternSolid;
		Height := 17;
		Shape := EXG2ANTTLib_TLB.exShapeSolid;
		Color := $ff0000;
	end;
	with Chart.Bars.Add('Task%Progress') do
	begin
		Pattern := EXG2ANTTLib_TLB.exPatternSolid;
		Height := 17;
		Shortcut := 'Percent';
	end;
	DefaultItemHeight := 21;
	with Items do
	begin
		h := AddItem('Task 1');
		AddBar(h,'Task','1/2/2001','1/5/2001','',Null);
		ItemBar[h,'',EXG2ANTTLib_TLB.exBarColor] := OleVariant(4112616);
		ItemBar[h,'',EXG2ANTTLib_TLB.exBarCaption] := '<fgcolor=FFFFFF><sha 0;;0>Pause';
		AddBar(h,'Task','1/9/2001','1/12/2001','white',Null);
		ItemBar[h,'white',EXG2ANTTLib_TLB.exBarColor] := OleVariant(4112616);
		ItemBar[h,'white',EXG2ANTTLib_TLB.exBarCaption] := '<fgcolor=FFFFFF>Pause';
		h := AddItem('Task 2');
		AddBar(h,'Task','1/3/2001','1/4/2001','',Null);
		ItemBar[h,'',EXG2ANTTLib_TLB.exBarColor] := OleVariant(2017557);
		ItemBar[h,'',EXG2ANTTLib_TLB.exBarCaption] := '<fgcolor=FFFFFF><sha 0;;0>Production';
		AddBar(h,'Task','1/10/2001','1/11/2001','white',Null);
		ItemBar[h,'white',EXG2ANTTLib_TLB.exBarColor] := OleVariant(2017557);
		ItemBar[h,'white',EXG2ANTTLib_TLB.exBarCaption] := '<fgcolor=FFFFFF>Production';
		h := AddItem('Task 3');
		AddBar(h,'Percent','1/3/2001','1/4/2001','',Null);
		ItemBar[h,'',EXG2ANTTLib_TLB.exBarPercent] := OleVariant(0.5);
		ItemBar[h,'',EXG2ANTTLib_TLB.exBarColor] := OleVariant(2017557);
		ItemBar[h,'',EXG2ANTTLib_TLB.exBarCaption] := '<fgcolor=FFFFFF><sha 0;;0>Pausing';
		AddBar(h,'Percent','1/10/2001','1/11/2001','white',Null);
		ItemBar[h,'white',EXG2ANTTLib_TLB.exBarPercent] := OleVariant(0.5);
		ItemBar[h,'white',EXG2ANTTLib_TLB.exBarColor] := OleVariant(2017557);
		ItemBar[h,'white',EXG2ANTTLib_TLB.exBarCaption] := '<fgcolor=FFFFFF>Pausing';
		h := AddItem('Task 4');
		AddBar(h,'Task','1/3/2001','1/4/2001','',Null);
		ItemBar[h,'',EXG2ANTTLib_TLB.exBarColor] := OleVariant(8421504);
		ItemBar[h,'',EXG2ANTTLib_TLB.exBarCaption] := '<fgcolor=FFFFFF><sha 0;;0>Planned downtime';
		AddBar(h,'Task','1/10/2001','1/11/2001','white',Null);
		ItemBar[h,'white',EXG2ANTTLib_TLB.exBarColor] := OleVariant(8421504);
		ItemBar[h,'white',EXG2ANTTLib_TLB.exBarCaption] := '<fgcolor=FFFFFF>Planned downtime';
	end;
	EndUpdate();
end
|
|
1641
|
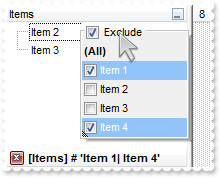
How do I programmatically exclude items from the filter
with G2antt1 do
begin
	BeginUpdate();
	LinesAtRoot := EXG2ANTTLib_TLB.exLinesAtRoot;
	with (IUnknown(Columns.Add('Items')) as EXG2ANTTLib_TLB.Column) do
	begin
		DisplayFilterButton := True;
		DisplayFilterPattern := False;
		FilterList := Integer(EXG2ANTTLib_TLB.exShowExclude) Or Integer(EXG2ANTTLib_TLB.exShowFocusItem) Or Integer(EXG2ANTTLib_TLB.exShowCheckBox);
	end;
	with Items do
	begin
		AddItem('Item 1');
		AddItem('Item 2');
		AddItem('Item 3');
		AddItem('Item 4');
	end;
	with Columns.Item[OleVariant(0)] do
	begin
		FilterType := Integer(EXG2ANTTLib_TLB.exFilterExclude) Or Integer(EXG2ANTTLib_TLB.exFilter);
		Filter := 'Item 1|Item 4';
	end;
	ApplyFilter();
	EndUpdate();
end
|
|
1640
|
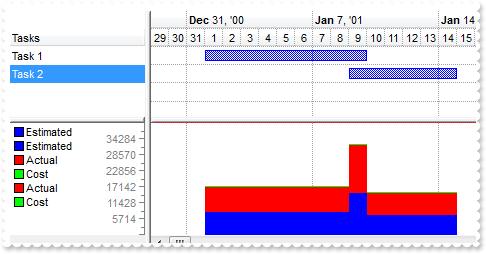
How do I show in histogram, more values for a single task
// BeforeExpandItem event - Fired before an item is about to be expanded (collapsed).
procedure TForm1.G2antt1BeforeExpandItem(ASender: TObject; Item : HITEM; var Cancel : OleVariant);
begin
	with G2antt1 do
	begin
		Cancel := True;
	end
end;

with G2antt1 do
begin
	BeginUpdate();
	SingleSel := True;
	ExpandOnDblClick := False;
	with Chart do
	begin
		LevelCount := 2;
		AllowLinkBars := False;
		DrawGridLines := EXG2ANTTLib_TLB.exAllLines;
		FirstVisibleDate := '12/29/2000';
		HistogramVisible := True;
		HistogramHeight := 167;
		PaneWidth[False] := 128;
		HistogramView := Integer(EXG2ANTTLib_TLB.exHistogramNoGrouping) Or Integer(EXG2ANTTLib_TLB.exHistogramUnlockedItems);
		with Bars.Item['Task'] do
		begin
			HistogramType := EXG2ANTTLib_TLB.exHistCumulative;
			HistogramItems := 6;
			HistogramPattern := EXG2ANTTLib_TLB.exPatternSolid;
			HistogramItems := -40000;
			HistogramCriticalValue := 100000;
			HistogramRulerLinesColor := $808080;
			HistogramCumulativeColors := 3;
		end;
		ShowNonworkingDates := False;
	end;
	(IUnknown(Columns.Add('Costs')) as EXG2ANTTLib_TLB.Column).Visible := False;
	(IUnknown(Columns.Add('Tasks')) as EXG2ANTTLib_TLB.Column).Visible := True;
	with Items do
	begin
		h := AddItem('Estimated');
		CellValue[OleVariant(h),OleVariant(1)] := 'Task 1';
		AddBar(h,'Task','1/1/2001','1/10/2001',Null,Null);
		ItemBar[h,'',EXG2ANTTLib_TLB.exBarEffort] := OleVariant(8000);
		hR := InsertItem(h,Null,'Actual');
		AddBar(hR,'Task','1/1/2001','1/10/2001',Null,Null);
		ItemBar[hR,'',EXG2ANTTLib_TLB.exBarEffort] := OleVariant(9000);
		GroupBars(h,'',True,hR,'',True,Null,Null);
		GroupBars(h,'',False,hR,'',False,Null,Null);
		hR := InsertItem(h,Null,'Cost');
		AddBar(hR,'Task','1/1/2001','1/10/2001',Null,Null);
		ItemBar[hR,'',EXG2ANTTLib_TLB.exBarEffort] := OleVariant(200);
		GroupBars(h,'',True,hR,'',True,Null,Null);
		GroupBars(h,'',False,hR,'',False,Null,Null);
		h := AddItem('Estimated');
		CellValue[OleVariant(h),OleVariant(1)] := 'Task 2';
		AddBar(h,'Task','1/9/2001','1/15/2001',Null,Null);
		ItemBar[h,'',EXG2ANTTLib_TLB.exBarEffort] := OleVariant(7000);
		hR := InsertItem(h,Null,'Actual');
		AddBar(hR,'Task','1/9/2001','1/15/2001',Null,Null);
		ItemBar[hR,'',EXG2ANTTLib_TLB.exBarEffort] := OleVariant(8000);
		GroupBars(h,'',True,hR,'',True,Null,Null);
		GroupBars(h,'',False,hR,'',False,Null,Null);
		hR := InsertItem(h,Null,'Cost');
		AddBar(hR,'Task','1/9/2001','1/15/2001',Null,Null);
		ItemBar[hR,'',EXG2ANTTLib_TLB.exBarEffort] := OleVariant(150);
		GroupBars(h,'',True,hR,'',True,Null,Null);
		GroupBars(h,'',False,hR,'',False,Null,Null);
	end;
	EndUpdate();
end
|
|
1639
|
How can I align the caption of the bar
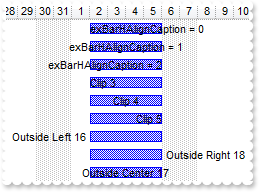
with G2antt1 do
begin
	BeginUpdate();
	Columns.Add('Tasks');
	with Chart do
	begin
		FirstVisibleDate := '12/25/2000';
		PaneWidth[False] := 48;
	end;
	with Items do
	begin
		h := AddItem('Task');
		AddBar(h,'Task','1/2/2001','1/6/2001','K','exBarHAlignCaption = 0');
		ItemBar[h,'K',EXG2ANTTLib_TLB.exBarHAlignCaption] := OleVariant(0);
		h := AddItem('Task');
		AddBar(h,'Task','1/2/2001','1/6/2001','K','exBarHAlignCaption = 1');
		ItemBar[h,'K',EXG2ANTTLib_TLB.exBarHAlignCaption] := OleVariant(1);
		h := AddItem('Task');
		AddBar(h,'Task','1/2/2001','1/6/2001','K','exBarHAlignCaption = 2');
		ItemBar[h,'K',EXG2ANTTLib_TLB.exBarHAlignCaption] := OleVariant(2);
		h := AddItem('Task');
		AddBar(h,'Task','1/2/2001','1/6/2001','K','Clip 3');
		ItemBar[h,'K',EXG2ANTTLib_TLB.exBarHAlignCaption] := OleVariant(3);
		h := AddItem('Task');
		AddBar(h,'Task','1/2/2001','1/6/2001','K','Clip 4');
		ItemBar[h,'K',EXG2ANTTLib_TLB.exBarHAlignCaption] := OleVariant(4);
		h := AddItem('Task');
		AddBar(h,'Task','1/2/2001','1/6/2001','K','Clip 5');
		ItemBar[h,'K',EXG2ANTTLib_TLB.exBarHAlignCaption] := OleVariant(5);
		h := AddItem('Task');
		AddBar(h,'Task','1/2/2001','1/6/2001','K','Outside Left 16');
		ItemBar[h,'K',EXG2ANTTLib_TLB.exBarHAlignCaption] := OleVariant(16);
		h := AddItem('Task');
		AddBar(h,'Task','1/2/2001','1/6/2001','K','Outside Right 18');
		ItemBar[h,'K',EXG2ANTTLib_TLB.exBarHAlignCaption] := OleVariant(18);
		h := AddItem('Task');
		AddBar(h,'Task','1/2/2001','1/6/2001','K','Outside Center 17');
		ItemBar[h,'K',EXG2ANTTLib_TLB.exBarHAlignCaption] := OleVariant(17);
	end;
	EndUpdate();
end
|
|
1638
|
How can I change the drop down filter background color
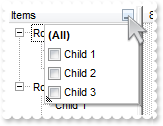
with G2antt1 do
begin
	BeginUpdate();
	LinesAtRoot := EXG2ANTTLib_TLB.exLinesAtRoot;
	Background[EXG2ANTTLib_TLB.exBackColorFilter] := $ffffff;
	with (IUnknown(Columns.Add('Items')) as EXG2ANTTLib_TLB.Column) do
	begin
		DisplayFilterButton := True;
		DisplayFilterPattern := False;
		FilterList := Integer(EXG2ANTTLib_TLB.exShowFocusItem) Or Integer(EXG2ANTTLib_TLB.exShowCheckBox) Or Integer(EXG2ANTTLib_TLB.exSortItemsAsc) Or Integer(EXG2ANTTLib_TLB.exLeafItems);
	end;
	with Items do
	begin
		h := AddItem('Root 1');
		InsertItem(h,Null,'Child 1');
		InsertItem(h,Null,'Child 2');
		ExpandItem[h] := True;
		h := AddItem('Root 2');
		InsertItem(h,Null,'Child 1');
		InsertItem(h,Null,'Child 2');
		InsertItem(h,Null,'Child 3');
		ExpandItem[h] := True;
	end;
	EndUpdate();
end
|
|
1637
|
How can I arrange the columns using CRD (eXCRD ) strings (Sample 2)
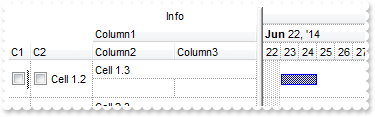
with G2antt1 do
begin
	BeginUpdate();
	DrawGridLines := EXG2ANTTLib_TLB.exAllLines;
	DefaultItemHeight := 36;
	with Columns do
	begin
		with (IUnknown(Add('C1')) as EXG2ANTTLib_TLB.Column) do
		begin
			Def[EXG2ANTTLib_TLB.exCellHasCheckBox] := OleVariant(True);
			Width := 18;
			AllowSizing := False;
		end;
		with (IUnknown(Add('C2')) as EXG2ANTTLib_TLB.Column) do
		begin
			Def[EXG2ANTTLib_TLB.exCellHasCheckBox] := OleVariant(True);
			Width := 18;
		end;
		(IUnknown(Add('Column1')) as EXG2ANTTLib_TLB.Column).Visible := False;
		(IUnknown(Add('Column2')) as EXG2ANTTLib_TLB.Column).Visible := False;
		(IUnknown(Add('Column3')) as EXG2ANTTLib_TLB.Column).Visible := False;
		with (IUnknown(Add('FormatLevel')) as EXG2ANTTLib_TLB.Column) do
		begin
			FormatLevel := '18;"Info"[a=17]/(2/3,4)';
			Def[EXG2ANTTLib_TLB.exCellFormatLevel] := '2/3,4';
		end;
	end;
	with Chart do
	begin
		DrawGridLines := EXG2ANTTLib_TLB.exAllLines;
		FirstVisibleDate := '6/22/2014';
	end;
	with Items do
	begin
		h := AddItem('Cell 1.1');
		CellValue[OleVariant(h),OleVariant(1)] := 'Cell 1.2';
		CellValue[OleVariant(h),OleVariant(2)] := 'Cell 1.3';
		AddBar(h,'Task','6/23/2014','6/25/2014',Null,Null);
		h := AddItem('Cell 2.1');
		CellValue[OleVariant(h),OleVariant(1)] := 'Cell 2.2';
		CellValue[OleVariant(h),OleVariant(2)] := 'Cell 2.3';
		AddBar(h,'Task','6/26/2014','6/28/2014',Null,Null);
	end;
	EndUpdate();
end
|
|
1636
|
How can I arrange the columns using CRD (eXCRD ) strings (Sample 1)
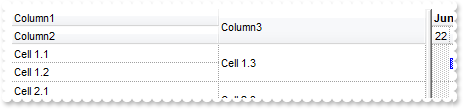
with G2antt1 do
begin
	BeginUpdate();
	DrawGridLines := EXG2ANTTLib_TLB.exAllLines;
	DefaultItemHeight := 36;
	with Columns do
	begin
		(IUnknown(Add('Column1')) as EXG2ANTTLib_TLB.Column).Visible := False;
		(IUnknown(Add('Column2')) as EXG2ANTTLib_TLB.Column).Visible := False;
		(IUnknown(Add('Column3')) as EXG2ANTTLib_TLB.Column).Visible := False;
		with (IUnknown(Add('FormatLevel')) as EXG2ANTTLib_TLB.Column) do
		begin
			FormatLevel := '(0/1),2';
			Def[EXG2ANTTLib_TLB.exCellFormatLevel] := OleVariant(FormatLevel);
		end;
	end;
	with Chart do
	begin
		DrawGridLines := EXG2ANTTLib_TLB.exAllLines;
		FirstVisibleDate := '6/22/2014';
	end;
	with Items do
	begin
		h := AddItem('Cell 1.1');
		CellValue[OleVariant(h),OleVariant(1)] := 'Cell 1.2';
		CellValue[OleVariant(h),OleVariant(2)] := 'Cell 1.3';
		AddBar(h,'Task','6/23/2014','6/25/2014',Null,Null);
		h := AddItem('Cell 2.1');
		CellValue[OleVariant(h),OleVariant(1)] := 'Cell 2.2';
		CellValue[OleVariant(h),OleVariant(2)] := 'Cell 2.3';
		AddBar(h,'Task','6/26/2014','6/28/2014',Null,Null);
	end;
	EndUpdate();
end
|
|
1635
|
How do I display the histogram for filtered items only
with G2antt1 do
begin
	BeginUpdate();
	SingleSel := False;
	with Chart do
	begin
		FirstVisibleDate := '1/1/2001';
		LevelCount := 2;
		HistogramVisible := True;
		HistogramHeight := 32;
		HistogramView := EXG2ANTTLib_TLB.exHistogramFilteredItems;
		Bars.Item['Task'].HistogramPattern := EXG2ANTTLib_TLB.exPatternBDiagonal;
	end;
	with (IUnknown(Columns.Add('Column')) as EXG2ANTTLib_TLB.Column) do
	begin
		DisplayFilterButton := True;
		Filter := 'Item 1';
		FilterType := EXG2ANTTLib_TLB.exFilter;
	end;
	with Items do
	begin
		AddBar(AddItem('Item 1'),'Task','1/2/2001','1/4/2001',Null,Null);
		AddBar(AddItem('Item 2'),'Task','1/3/2001','1/7/2001',Null,Null);
	end;
	ApplyFilter();
	EndUpdate();
end
|
|
1634
|
How can I use no scroll bars for touch-screens
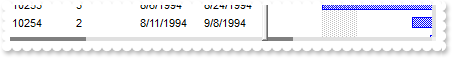
// AddItem event - Occurs after a new Item has been inserted to Items collection.
procedure TForm1.G2antt1AddItem(ASender: TObject; Item : HITEM);
begin
	with G2antt1 do
	begin
		with Items do
		begin
			AddBar(Item,'Task',CellValue[OleVariant(Item),OleVariant(2)],CellValue[OleVariant(Item),OleVariant(4)],Null,Null);
		end;
	end
end;

// MouseMove event - Occurs when the user moves the mouse.
procedure TForm1.G2antt1MouseMove(ASender: TObject; Button : Smallint; Shift : Smallint; X : Integer; Y : Integer);
begin
	with G2antt1 do
	begin
		ShowToolTip('<font ;6><sha ;;0><off -4>Tip</off></sha></font> If the cursor hovers bars, click and wait for a second to start scrolling.',Null,Null,Null,Null);
	end
end;

with G2antt1 do
begin
	BeginUpdate();
	with Chart do
	begin
		AllowCreateBar := EXG2ANTTLib_TLB.exNoCreateBar;
		FirstVisibleDate := '8/3/1994';
		PaneWidth[False] := 256;
		LevelCount := 2;
		UnitScale := EXG2ANTTLib_TLB.exDay;
		FirstWeekDay := EXG2ANTTLib_TLB.exMonday;
		OverviewVisible := EXG2ANTTLib_TLB.exOverviewShowAllVisible;
	end;
	ColumnAutoResize := False;
	ContinueColumnScroll := False;
	rs := (IUnknown(ComObj.CreateComObject(ComObj.ProgIDToClassID('ADOR.Recordset'))) as ADODB_TLB.Recordset);
	with rs do
	begin
		Open('Orders','Provider=Microsoft.ACE.OLEDB.12.0;Data Source=C:\Program Files\Exontrol\ExG2antt\Sample\Access\misc.accdb',3,3,Null);
	end;
	DataSource := (IUnknown(rs) as ADODB_TLB.Recordset);
	AutoDrag := EXG2ANTTLib_TLB.exAutoDragScroll;
	ScrollWidth := 4;
	ScrollHeight := 4;
	Background[EXG2ANTTLib_TLB.exHSLeft] := $c0c0c0;
	Background[EXG2ANTTLib_TLB.exHSRight] := $c0c0c0;
	Background[EXG2ANTTLib_TLB.exHSBack] := $e0e0e0;
	Background[EXG2ANTTLib_TLB.exHSThumb] := $808080;
	Background[EXG2ANTTLib_TLB.exVSBack] := $e0e0e0;
	Background[EXG2ANTTLib_TLB.exVSDown] := $c0c0c0;
	Background[EXG2ANTTLib_TLB.exVSThumb] := $808080;
	Background[EXG2ANTTLib_TLB.exVSUp] := $c0c0c0;
	ScrollButtonWidth := 0;
	ScrollButtonHeight := 0;
	EndUpdate();
end
|
|
1633
|
How can I display values in the histogram legend
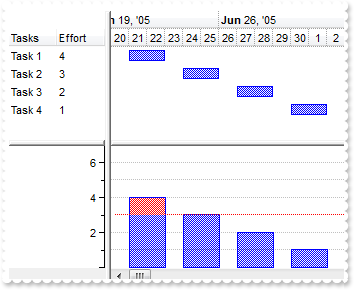
with G2antt1 do
begin
	BeginUpdate();
	Columns.Add('Tasks');
	with (IUnknown(Columns.Add('Effort')) as EXG2ANTTLib_TLB.Column) do
	begin
		Def[EXG2ANTTLib_TLB.exCellValueToItemBarProperty] := OleVariant(21);
		Editor.EditType := EXG2ANTTLib_TLB.SpinType;
	end;
	with Chart do
	begin
		LevelCount := 2;
		NonworkingDays := 0;
		PaneWidth[False] := 96;
		FirstVisibleDate := '6/20/2005';
		HistogramVisible := True;
		HistogramHeight := 128;
		HistogramView := EXG2ANTTLib_TLB.exHistogramAllItems;
		with Bars.Item['Task'] do
		begin
			HistogramPattern := Pattern;
			HistogramType := EXG2ANTTLib_TLB.exHistOverload;
			HistogramCriticalValue := 3;
			HistogramItems := -7;
			HistogramGridLinesColor := $c0c0c0;
			HistogramRulerLinesColor := $10000;
		end;
	end;
	with Items do
	begin
		AllowCellValueToItemBar := True;
		h1 := AddItem('Task 1');
		AddBar(h1,'Task','6/21/2005','6/23/2005',Null,Null);
		CellValue[OleVariant(h1),OleVariant(1)] := OleVariant(4);
		h1 := AddItem('Task 2');
		AddBar(h1,'Task','6/24/2005','6/26/2005',Null,Null);
		CellValue[OleVariant(h1),OleVariant(1)] := OleVariant(3);
		h1 := AddItem('Task 3');
		AddBar(h1,'Task','6/27/2005','6/29/2005',Null,Null);
		CellValue[OleVariant(h1),OleVariant(1)] := OleVariant(2);
		h1 := AddItem('Task 4');
		AddBar(h1,'Task','6/30/2005','7/2/2005',Null,Null);
		CellValue[OleVariant(h1),OleVariant(1)] := OleVariant(1);
	end;
	EndUpdate();
end
|
|
1632
|
I am using AllowGroupBy property and calling the Column.SortOrder property groups by that column. Is it possible to prevent that, so I have a similar behavior like I click the column's header rather than dragging it to the control's GroupBy bar
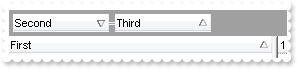
with G2antt1 do
begin
	with Columns do
	begin
		Add('First');
		Add('Second');
		Add('Third');
	end;
	SortBarVisible := True;
	SingleSort := False;
	AllowGroupBy := True;
	Layout := 'SingleSort = "C0:1";MultipleSort = "C1:2 C2:1"';
end
|
|
1631
|
Calling programatically the Column.SortOrder property adds the column to the sort bar. Is it possible to prevent that, so I have a similar behavior like I click the column's header rather than dragging it to the control's Sort bar
with G2antt1 do
begin
	with Columns do
	begin
		Add('First');
		Add('Second');
		Add('Third');
	end;
	SortBarVisible := True;
	SingleSort := False;
	Layout := 'SingleSort = "C0:1"';
end
|
|
1630
|
How can I specify different working parts for different items
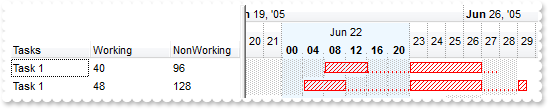
with G2antt1 do
begin
	BeginUpdate();
	with Columns do
	begin
		Add('Tasks');
		with (IUnknown(Add('Working')) as EXG2ANTTLib_TLB.Column) do
		begin
			Def[EXG2ANTTLib_TLB.exCellValueToItemBarProperty] := OleVariant(258);
			Def[EXG2ANTTLib_TLB.exCellValueToItemBarKey] := 'A';
			FormatColumn := '(0:=round(value*24)) != 0 ? =:0 : ''''';
		end;
		with (IUnknown(Add('NonWorking')) as EXG2ANTTLib_TLB.Column) do
		begin
			Def[EXG2ANTTLib_TLB.exCellValueToItemBarProperty] := OleVariant(259);
			Def[EXG2ANTTLib_TLB.exCellValueToItemBarKey] := 'A';
			FormatColumn := '(0:=round(value*24)) != 0 ? =:0 : ''''';
		end;
	end;
	with Chart do
	begin
		PaneWidth[False] := 78;
		AllowCreateBar := EXG2ANTTLib_TLB.exCreateBarAuto;
		FirstVisibleDate := '6/20/2005';
		DrawLevelSeparator := EXG2ANTTLib_TLB.exLevelNoLine;
		LevelCount := 3;
		Level[1].DrawGridLines := False;
		AllowInsideZoom := True;
		DrawDateTicker := True;
		DateTickerLabel := '<%mmm%> <%d%><br><b><%hh%>:<%nn%></b>';
		MarkSelectDateColor := $7ffff8ee;
		with DefaultInsideZoomFormat do
		begin
			OwnerLabel := '<%mmm%> <%d%>';
			BackColor := $fff8ee;
			BackColorChart := BackColor;
			InsideCount := 4;
			InsideLabel := '<b><%hh%></b>';
		end;
		InsideZooms.Add('6/22/2005');
		DrawGridLines := EXG2ANTTLib_TLB.exVLines;
		Bars.Item['Split'].Color := $ff;
		with Bars.Add('Task:Split') do
		begin
			Color := $ff;
			Pattern := EXG2ANTTLib_TLB.exPatternBDiagonal;
			Shortcut := 'Task';
		end;
	end;
	with Items do
	begin
		AllowCellValueToItemBar := True;
		h1 := AddItem('Task 1');
		AddBar(h1,'Task','6/22/2005 8:00:00 AM','6/28/2005','A',Null);
		ItemBar[h1,'A',EXG2ANTTLib_TLB.exBarKeepWorkingCount] := OleVariant(True);
		ItemNonworkingUnits[h1,OleVariant(False)] := 'weekday(value) in (1,2)';
		ItemNonworkingUnits[h1,OleVariant(True)] := 'weekday(value) in (1,2) or (hour(value)<8 or hour(value)>=16 )';
		h2 := AddItem('Task 1');
		AddBar(h2,'Task','6/22/2005 4:00:00 AM','6/29/2005 12:00:00 PM','A',Null);
		ItemBar[h2,'A',EXG2ANTTLib_TLB.exBarKeepWorkingCount] := OleVariant(True);
		ItemNonworkingUnits[h2,OleVariant(False)] := 'weekday(value) in (1,2)';
		ItemNonworkingUnits[h2,OleVariant(True)] := 'weekday(value) in (1, 2) or (hour(value)<4 or hour(value)>=12 )';
	end;
	EndUpdate();
end
|
|
1629
|
How can I define the default bar's foreground color
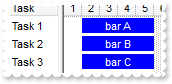
with G2antt1 do
begin
	BeginUpdate();
	Columns.Add('Task');
	with Chart do
	begin
		FirstVisibleDate := '1/1/2001';
		PaneWidth[False] := 48;
		with Bars.Item['Task'] do
		begin
			Height := 15;
			Pattern := EXG2ANTTLib_TLB.exPatternSolid;
			Def[EXG2ANTTLib_TLB.exBarForeColor] := OleVariant(16777215);
		end;
	end;
	with Items do
	begin
		AddBar(AddItem('Task 1'),'Task','1/2/2001','1/6/2001','K1','bar A');
		AddBar(AddItem('Task 2'),'Task','1/2/2001','1/6/2001','K2','bar B');
		AddBar(AddItem('Task 3'),'Task','1/2/2001','1/6/2001','K3','bar C');
	end;
	EndUpdate();
end
|
|
1628
|
How can I print the selected items only
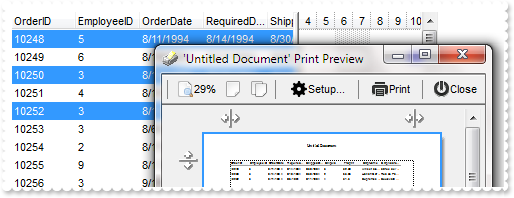
// AddItem event - Occurs after a new Item has been inserted to Items collection.
procedure TForm1.G2antt1AddItem(ASender: TObject; Item : HITEM);
begin
	with G2antt1 do
	begin
		with Items do
		begin
			AddBar(Item,'Task',CellValue[OleVariant(Item),OleVariant(2)],CellValue[OleVariant(Item),OleVariant(4)],Null,Null);
		end;
	end
end;

with G2antt1 do
begin
	BeginUpdate();
	SingleSel := False;
	ColumnAutoResize := False;
	ContinueColumnScroll := False;
	rs := (IUnknown(ComObj.CreateComObject(ComObj.ProgIDToClassID('ADOR.Recordset'))) as ADODB_TLB.Recordset);
	with rs do
	begin
		Open('Orders','Provider=Microsoft.ACE.OLEDB.12.0;Data Source=C:\Program Files\Exontrol\ExG2antt\Sample\Access\misc.accdb',3,3,Null);
	end;
	DataSource := (IUnknown(rs) as ADODB_TLB.Recordset);
	Chart.FirstVisibleDate := '8/4/1994';
	with Items do
	begin
		SelectItem[ItemByIndex[0]] := True;
		SelectItem[ItemByIndex[2]] := True;
		SelectItem[ItemByIndex[4]] := True;
	end;
	EndUpdate();
	with (IUnknown(ComObj.CreateComObject(ComObj.ProgIDToClassID('Exontrol.Print'))) as EXPRINTLib_TLB.Print) do
	begin
		Options := 'Print = Selection';
		PrintExt := (IUnknown(G2antt1.DefaultInterface) as EXG2ANTTLib_TLB.G2antt);
		Preview();
	end;
end
|
|
1627
|
How can I sort the columns to be displayed on the columns floating bar
with G2antt1 do
begin
	ColumnAutoResize := False;
	with Columns do
	begin
		(IUnknown(Add('City')) as EXG2ANTTLib_TLB.Column).Visible := False;
		(IUnknown(Add('Start')) as EXG2ANTTLib_TLB.Column).Visible := False;
		(IUnknown(Add('End')) as EXG2ANTTLib_TLB.Column).Visible := False;
	end;
	ColumnsFloatBarVisible := EXG2ANTTLib_TLB.exColumnsFloatBarVisibleIncludeHiddenColumns;
	ColumnsFloatBarSortOrder := EXG2ANTTLib_TLB.SortAscending;
end
|
|
1626
|
How can I add a vertical padding for my cells
with G2antt1 do
begin
	BeginUpdate();
	DrawGridLines := EXG2ANTTLib_TLB.exAllLines;
	with (IUnknown(Columns.Add('Padding')) as EXG2ANTTLib_TLB.Column) do
	begin
		Def[EXG2ANTTLib_TLB.exCellHasCheckBox] := OleVariant(True);
		Def[EXG2ANTTLib_TLB.exCellSingleLine] := OleVariant(False);
		Def[EXG2ANTTLib_TLB.exCellPaddingLeft] := OleVariant(6);
		Def[EXG2ANTTLib_TLB.exCellPaddingRight] := OleVariant(6);
		Def[EXG2ANTTLib_TLB.exCellPaddingTop] := OleVariant(6);
		Def[EXG2ANTTLib_TLB.exCellPaddingBottom] := OleVariant(6);
	end;
	with Items do
	begin
		AddItem('padding');
		AddItem('padding');
	end;
	EndUpdate();
end
|
|
1625
|
Trying to fill the second columns. How can I do that
with G2antt1 do
begin
	BeginUpdate();
	with Columns do
	begin
		Add('Column 1');
		Add('Column 2');
		Add('Column 3');
	end;
	with Items do
	begin
		h := AddItem('SubItem 1.1');
		CellValue[OleVariant(h),OleVariant(1)] := 'SubItem 1.2';
		CellValue[OleVariant(h),OleVariant(2)] := 'SubItem 1.3';
		h := AddItem('SubItem 2.1');
		CellValue[OleVariant(h),OleVariant(1)] := 'SubItem 2.2';
		CellValue[OleVariant(h),OleVariant(2)] := 'SubItem 2.3';
	end;
	EndUpdate();
end
|
|
1624
|
How can I specify a different background color for item, in chart or list panels
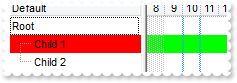
with G2antt1 do
begin
	Columns.Add('Default');
	with Items do
	begin
		h := AddItem('Root');
		hC := InsertItem(h,Null,'Child 1');
		ItemBackColor[hC] := $ff;
		G2antt1.Chart.ItemBackColor[hC] := $ff00;
		InsertItem(h,Null,'Child 2');
		ExpandItem[h] := True;
	end;
end
|
|
1623
|
Is it possible to specify a status part for each bar
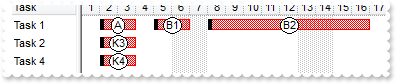
with G2antt1 do
begin
	BeginUpdate();
	Columns.Add('Task');
	Chart.FirstVisibleDate := '1/1/2001';
	Chart.PaneWidth[False] := 64;
	Debug := True;
	VisualAppearance.Add(1,'gBFLBCJwBAEHhEJAAChABL8IQAAYAQGKIaBwAKBQAGaAoDDQNgyQwAAxwdBMKgBBCLIxhEYobgmGIaRjHcQjEKoSxHEqIRpGCRoJiqLIZAJIEZRZAcaQvGSQYRASCRND' +
	'EOA0TDAY4jPD4aQiGIbRjjeL5YjiNo2UxTNRQCEB');
	with Items do
	begin
		h := AddItem('Task 1');
		AddBar(h,'Task','1/2/2001','1/4/2001','A',Null);
		AddBar(h,'Task','1/5/2001','1/7/2001','B1',Null);
		AddBar(h,'Task','1/8/2001','1/17/2001','B2',Null);
		AddBar(AddItem('Task 2'),'Task','1/2/2001','1/4/2001','K3',Null);
		AddBar(AddItem('Task 4'),'Task','1/2/2001','1/4/2001','K4',Null);
		ItemBar[0,'<*>',EXG2ANTTLib_TLB.exBarColor] := OleVariant(255);
		ItemBar[0,'<*>',EXG2ANTTLib_TLB.exBarFrameColor] := OleVariant(16777216);
	end;
	EndUpdate();
end
|
|
1622
|
How can I change the the focus rectangle
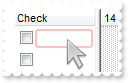
with G2antt1 do
begin
	BeginUpdate();
	VisualAppearance.Add(1,'C:\Program Files\Exontrol\ExG2antt\sample\EBN\hoverinsert.ebn');
	Background[EXG2ANTTLib_TLB.exShowFocusRect] := $1000000;
	with (IUnknown(Columns.Add('Check')) as EXG2ANTTLib_TLB.Column) do
	begin
		Def[EXG2ANTTLib_TLB.exCellPaddingLeft] := OleVariant(2);
		Def[EXG2ANTTLib_TLB.exCellHasCheckBox] := OleVariant(True);
	end;
	SelForeColor := ForeColor;
	SelBackColor := BackColor;
	DefaultItemHeight := 22;
	ShowFocusRect := True;
	with Items do
	begin
		AddItem('');
		AddItem('');
	end;
	EndUpdate();
end
|
|
1621
|
Can each cell have their own dropdown lists that contain "different list item values" for each cell, not predefined for the entire column
with G2antt1 do
begin
	BeginUpdate();
	with (IUnknown(Columns.Add('Column/Cell-Same')) as EXG2ANTTLib_TLB.Column).Editor do
	begin
		EditType := EXG2ANTTLib_TLB.DropDownListType;
		AddItem(0,'Zero',Null);
		AddItem(1,'One',Null);
		AddItem(2,'Two',Null);
	end;
	with (IUnknown(Columns.Add('Column/Cell-Different')) as EXG2ANTTLib_TLB.Column).Editor do
	begin
		EditType := EXG2ANTTLib_TLB.EditType;
	end;
	with Items do
	begin
		AddItem(Null);
		h := AddItem(OleVariant(0));
		with CellEditor[OleVariant(h),OleVariant(1)] do
		begin
			EditType := EXG2ANTTLib_TLB.DropDownListType;
			AddItem(3,'Three',Null);
			AddItem(4,'Four',Null);
		end;
		CellValue[OleVariant(h),OleVariant(1)] := OleVariant(3);
		AddItem(Null);
		h := AddItem(OleVariant(0));
		with CellEditor[OleVariant(h),OleVariant(1)] do
		begin
			EditType := EXG2ANTTLib_TLB.CheckListType;
			AddItem(1,'Single',Null);
			AddItem(2,'Double',Null);
		end;
		CellValue[OleVariant(h),OleVariant(1)] := OleVariant(3);
	end;
	EndUpdate();
end
|
|
1620
|
How can I specify just a few fonts in a FontType editor
with G2antt1 do
begin
	BeginUpdate();
	DefaultItemHeight := 22;
	DrawGridLines := EXG2ANTTLib_TLB.exRowLines;
	with (IUnknown(Columns.Add('Fonts')) as EXG2ANTTLib_TLB.Column).Editor do
	begin
		EditType := EXG2ANTTLib_TLB.FontType;
		ClearItems();
		AddItem(0,'Calibri',Null);
		AddItem(1,'Arial',Null);
		AddItem(2,'Rockwell',Null);
		AddItem(3,'Tahoma',Null);
		SortItems(OleVariant(True),Null);
		DropDownRows := 4;
	end;
	with Items do
	begin
		AddItem('Tahoma');
	end;
	EndUpdate();
end
|
|
1619
|
How can I show only the working-hours in chart and histogram panels
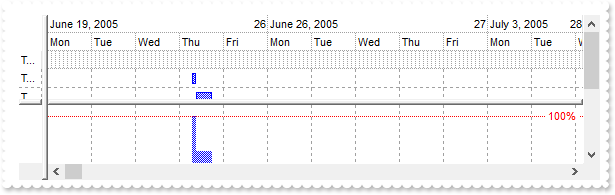
with G2antt1 do
begin
	BeginUpdate();
	Columns.Add('Tasks');
	DrawGridLines := EXG2ANTTLib_TLB.exAllLines;
	with Chart do
	begin
		PaneWidth[False] := 40;
		FirstVisibleDate := '6/20/2005';
		HistogramVisible := True;
		HistogramHeight := 64;
		HistogramView := EXG2ANTTLib_TLB.exHistogramAllItems;
		LevelCount := 3;
		NonworkingHours := 16253183;
		with Bars.Item['Task'] do
		begin
			HistogramType := EXG2ANTTLib_TLB.exHistOverAllocation;
			HistogramPattern := Pattern;
		end;
		ShowNonworkingDates := False;
		ShowNonworkingUnits := False;
		ShowNonworkingHours := False;
		DrawGridLines := EXG2ANTTLib_TLB.exAllLines;
		UnitScale := EXG2ANTTLib_TLB.exHour;
		UnitWidth := 4;
		ResizeUnitScale := UnitScale;
	end;
	with Items do
	begin
		h := AddItem('Task A');
		AddBar(h,'Task','6/23/2005 11:00:00 AM','6/23/2005 12:00:00 PM',Null,Null);
		ItemBar[h,'',EXG2ANTTLib_TLB.exBarEffort] := '0.0416666';
		ItemBar[h,'',EXG2ANTTLib_TLB.exBarKeepWorkingCount] := OleVariant(True);
		h := AddItem('Task B');
		AddBar(h,'Task','6/23/2005 12:00:00 PM','6/23/2005 4:00:00 PM',Null,Null);
		ItemBar[h,'',EXG2ANTTLib_TLB.exBarEffort] := '0.0416666';
		ItemBar[h,'',EXG2ANTTLib_TLB.exBarKeepWorkingCount] := OleVariant(True);
	end;
	EndUpdate();
end
|
|
1618
|
How do you embed HTML options into the anchor click string
// AnchorClick event - Occurs when an anchor element is clicked.
procedure TForm1.G2antt1AnchorClick(ASender: TObject; AnchorID : WideString; Options : WideString);
begin
	with G2antt1 do
	begin
		OutputDebugString( AnchorID );
		OutputDebugString( Options );
	end
end;

with G2antt1 do
begin
	BeginUpdate();
	with Columns do
	begin
		(IUnknown(Add('Car')) as EXG2ANTTLib_TLB.Column).Def[EXG2ANTTLib_TLB.exCellValueFormat] := OleVariant(1);
	end;
	with Items do
	begin
		AddItem('<a mazda_1;options for 1>Mazda <b>1</b></a>');
		AddItem('<a mazda_2;options for 2>Mazda <b>2</b></a>');
		AddItem('<a mazda_3;options for 3a>Mazda <b>3.a</b></a>');
		AddItem('<a mazda_3;options for 3b>Mazda <b>3.b</b></a>');
	end;
	EndUpdate();
end
|
|
1617
|
How do I add a checkbox column (method 2)

// CellStateChanged event - Fired after cell's state has been changed.
procedure TForm1.G2antt1CellStateChanged(ASender: TObject; Item : HITEM; ColIndex : Integer);
begin
	with G2antt1 do
	begin
		OutputDebugString( 'CheckBox Changed:' );
		OutputDebugString( Items.CellState[OleVariant(Item),OleVariant(ColIndex)] );
	end
end;

with G2antt1 do
begin
	BeginUpdate();
	(IUnknown(Columns.Add('Check')) as EXG2ANTTLib_TLB.Column).Def[EXG2ANTTLib_TLB.exCellHasCheckBox] := OleVariant(True);
	with Items do
	begin
		CellState[OleVariant(AddItem('Check 1')),OleVariant(0)] := 0;
		CellState[OleVariant(AddItem('Check 2')),OleVariant(0)] := 1;
		CellState[OleVariant(AddItem('Check 3')),OleVariant(0)] := 0;
		CellState[OleVariant(AddItem('Check 4')),OleVariant(0)] := 1;
	end;
	EndUpdate();
end
|
|
1616
|
How do I add a checkbox column (method 1)
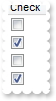
// Change event - Occurs when the user changes the cell's content.
procedure TForm1.G2antt1Change(ASender: TObject; Item : HITEM; ColIndex : Integer; var NewValue : OleVariant);
begin
	with G2antt1 do
	begin
		OutputDebugString( 'CheckBox Changed:' );
		OutputDebugString( NewValue );
	end
end;

with G2antt1 do
begin
	BeginUpdate();
	with (IUnknown(Columns.Add('Check')) as EXG2ANTTLib_TLB.Column) do
	begin
		with Editor do
		begin
			EditType := EXG2ANTTLib_TLB.CheckValueType;
			Option[EXG2ANTTLib_TLB.exCheckValue2] := OleVariant(1);
		end;
	end;
	with Items do
	begin
		AddItem(OleVariant(0));
		AddItem(OleVariant(1));
		AddItem(OleVariant(0));
		AddItem(OleVariant(1));
	end;
	EndUpdate();
end
|
|
1615
|
How do I change the progress bar's appearance
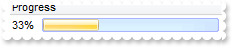
with G2antt1 do
begin
	with VisualAppearance do
	begin
		Add(1,'c:\exontrol\images\normal.ebn');
		Add(2,'c:\exontrol\images\pushed.ebn');
	end;
	var_Editor := (IUnknown(Columns.Add('Progress')) as EXG2ANTTLib_TLB.Column).Editor;
	with var_Editor do
	begin
		EditType := EXG2ANTTLib_TLB.ProgressBarType;
		Option[EXG2ANTTLib_TLB.exProgressBarBackColor] := OleVariant(16777216);
		Option[EXG2ANTTLib_TLB.exProgressBarMarkTicker] := OleVariant(33554432);
	end;
	Items.AddItem(OleVariant(33));
end
|
|
1614
|
I have the rows with different background color, and when I select the item it takes the color of the SelBackColor, and therefore is no longer visible behind the color. Is there any option to make the item's color being visible (method 3)
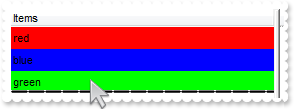
with G2antt1 do
begin
	BeginUpdate();
	VisualAppearance.Add(1,'gBFLBCJwBAEHhEJAEGg4BVEIQAAYAQGKIYBkAKBQAGaAoDDMOQwQwAAxjGKEEwsACEIrjKCRShyCYZRhGcTSBCIZBqEqSZLiEZRQCWIAzATGYBRfIUEgjBM6ExwG78eg' +
	'BHp/ZpkACIJJAaRjHQdJxGKKMQB9DIhCZpeKhWgkKIJBzOEyBRC4ERBGqNGrsIgLEqWZpnWhaNpWXYTLyBN64LhuK46g53O6wLxvK6hEr2dJ/YBcIAOfghf4NQ7EMRxL' +
	'C8Mw3BDvYDkOAABAIgI=');
	SelBackColor := $1fffffe;
	SelForeColor := RGB(0,0,0);
	SelBackColor := $1000000;
	ShowFocusRect := False;
	Columns.Add('Items');
	DefaultItemHeight := 22;
	with Items do
	begin
		ItemBackColor[AddItem('red')] := $ff;
		ItemBackColor[AddItem('blue')] := $ff0000;
		ItemBackColor[AddItem('green')] := $ff00;
	end;
	EndUpdate();
end
|
|
1613
|
I have the rows with different background color, and when I select the item it takes the color of the SelBackColor, and therefore is no longer visible behind the color. Is there any option to make the item's color being visible (method 2)
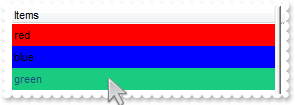
with G2antt1 do
begin
	BeginUpdate();
	SelBackMode := EXG2ANTTLib_TLB.exTransparent;
	DefaultItemHeight := 22;
	ShowFocusRect := False;
	Columns.Add('Items');
	with Items do
	begin
		ItemBackColor[AddItem('red')] := $ff;
		ItemBackColor[AddItem('blue')] := $ff0000;
		ItemBackColor[AddItem('green')] := $ff00;
	end;
	EndUpdate();
end
|
|
1612
|
I have the rows with different background color, and when I select the item it takes the color of the SelBackColor, and therefore is no longer visible behind the color. Is there any option to make the item's color being visible (method 1)
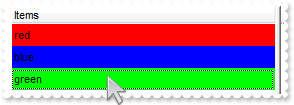
with G2antt1 do
begin
	BeginUpdate();
	SelBackColor := BackColor;
	SelForeColor := ForeColor;
	DefaultItemHeight := 22;
	ShowFocusRect := True;
	Columns.Add('Items');
	with Items do
	begin
		ItemBackColor[AddItem('red')] := $ff;
		ItemBackColor[AddItem('blue')] := $ff0000;
		ItemBackColor[AddItem('green')] := $ff00;
	end;
	EndUpdate();
end
|
|
1611
|
The BeforeExpandItem event is fired when clicking the drop down filter button. What we can do to prevent that
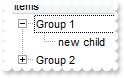
// BeforeExpandItem event - Fired before an item is about to be expanded (collapsed).
procedure TForm1.G2antt1BeforeExpandItem(ASender: TObject; Item : HITEM; var Cancel : OleVariant);
begin
	with G2antt1 do
	begin
		OutputDebugString( 'BeforeExpandItem' );
		OutputDebugString( Item );
		Items.InsertItem(Item,Null,'new child');
	end
end;

with G2antt1 do
begin
	BeginUpdate();
	LinesAtRoot := EXG2ANTTLib_TLB.exLinesAtRoot;
	with Columns do
	begin
		with (IUnknown(Add('Items')) as EXG2ANTTLib_TLB.Column) do
		begin
			DisplayFilterButton := True;
			FilterList := EXG2ANTTLib_TLB.exRootItems;
		end;
	end;
	with Items do
	begin
		ItemHasChildren[InsertItem(Null,Null,'Group 1')] := True;
		ItemHasChildren[InsertItem(Null,Null,'Group 2')] := True;
	end;
	EndUpdate();
end
|
|
1610
|
How can identify when I clicked Hour, Month, or Year of the time-scale overview
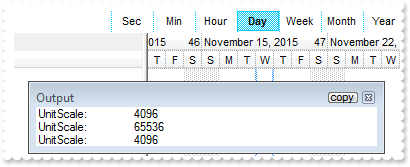
// OverviewZoom event - Occurs once the user selects a new time scale unit in the overview zoom area.
procedure TForm1.G2antt1OverviewZoom(ASender: TObject; );
begin
	with G2antt1 do
	begin
		OutputDebugString( 'UnitScale: ' );
		OutputDebugString( Chart.UnitScale );
	end
end;

with G2antt1 do
begin
	with Chart do
	begin
		PaneWidth[False] := 128;
		LevelCount := 2;
		OverviewVisible := EXG2ANTTLib_TLB.exOverviewShowAllVisible;
		AllowOverviewZoom := EXG2ANTTLib_TLB.exAlwaysZoom;
	end;
end
|
|
1609
|
How can define a minimum and maximum in a column SpinType
with G2antt1 do
begin
	with Columns do
	begin
		with (IUnknown(Add('SpinType between 5 and 150')) as EXG2ANTTLib_TLB.Column).Editor do
		begin
			EditType := EXG2ANTTLib_TLB.SliderType;
			Numeric := EXG2ANTTLib_TLB.exInteger;
			Option[EXG2ANTTLib_TLB.exSliderWidth] := OleVariant(0);
			Option[EXG2ANTTLib_TLB.exSliderMin] := OleVariant(5);
			Option[EXG2ANTTLib_TLB.exSliderMax] := OleVariant(150);
		end;
	end;
	Items.AddItem(OleVariant(50));
end
|
|
1608
|
How I can change the title of the time-scale overview. (Example: Month by 'Mes', Day by 'Dia')
with G2antt1 do
begin
with Chart do
begin
PaneWidth[False] := 128;
LevelCount := 2;
OverviewVisible := EXG2ANTTLib_TLB.exOverviewShowAllVisible;
AllowOverviewZoom := EXG2ANTTLib_TLB.exAlwaysZoom;
OverviewZoomCaption := 'A�o|||Mes|||Dia|||';
Label[EXG2ANTTLib_TLB.exHalfYear] := '';
Label[EXG2ANTTLib_TLB.exQuarterYear] := '';
Label[EXG2ANTTLib_TLB.exThirdMonth] := '';
Label[EXG2ANTTLib_TLB.exWeek] := '';
Label[EXG2ANTTLib_TLB.exHour] := '';
Label[EXG2ANTTLib_TLB.exMinute] := '';
Label[EXG2ANTTLib_TLB.exSecond] := '';
end;
end
|
|
1607
|
Is it possible to set a fixed wide for the Items List Arrea, so that when changing the Form.width, the Items List Arrea be constant and therefor changing the Chart Area-wide
with G2antt1 do
begin
	OnResizeControl := EXG2ANTTLib_TLB.exResizeChart;
end
|
|
1606
|
How can I clear the colors for all bars at once
with G2antt1 do
begin
	BeginUpdate();
	Columns.Add('Task');
	Chart.FirstVisibleDate := '1/1/2001';
	Chart.PaneWidth[False] := 64;
	Debug := True;
	with Items do
	begin
		h := AddItem('Task 1');
		AddBar(h,'Task','1/2/2001','1/4/2001','A',Null);
		ItemBar[h,'A',EXG2ANTTLib_TLB.exBarColor] := OleVariant(65280);
		AddBar(h,'Task','1/5/2001','1/7/2001','B1',Null);
		AddBar(h,'Task','1/8/2001','1/17/2001','B2',Null);
		AddBar(AddItem('Task 2'),'Task','1/2/2001','1/4/2001','K3',Null);
		AddBar(AddItem('Task 4'),'Task','1/2/2001','1/4/2001','K4',Null);
		ItemBar[0,'<*>',EXG2ANTTLib_TLB.exBarColor] := OleVariant(0);
	end;
	EndUpdate();
end
|
|
1605
|
How can I change the colors for all bars at once
with G2antt1 do
begin
	BeginUpdate();
	Columns.Add('Task');
	Chart.FirstVisibleDate := '1/1/2001';
	Chart.PaneWidth[False] := 64;
	Debug := True;
	with Items do
	begin
		h := AddItem('Task 1');
		AddBar(h,'Task','1/2/2001','1/4/2001','A',Null);
		AddBar(h,'Task','1/5/2001','1/7/2001','B1',Null);
		AddBar(h,'Task','1/8/2001','1/17/2001','B2',Null);
		AddBar(AddItem('Task 2'),'Task','1/2/2001','1/4/2001','K3',Null);
		AddBar(AddItem('Task 4'),'Task','1/2/2001','1/4/2001','K4',Null);
		ItemBar[0,'<*>',EXG2ANTTLib_TLB.exBarColor] := OleVariant(255);
	end;
	EndUpdate();
end
|
|
1604
|
How can I show my custom bars in the histogram (method 3)
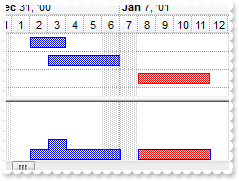
with G2antt1 do
begin
	BeginUpdate();
	with Chart do
	begin
		LevelCount := 2;
		AllowLinkBars := False;
		DrawGridLines := EXG2ANTTLib_TLB.exAllLines;
		FirstVisibleDate := '12/31/2000';
		HistogramVisible := True;
		HistogramHeight := 64;
		PaneWidth[False] := 128;
		with Bars.Item['Task'] do
		begin
			HistogramType := EXG2ANTTLib_TLB.exHistCumulative;
			HistogramItems := 6;
			HistogramPattern := Pattern;
			HistogramCumulativeOriginalColorBars := EXG2ANTTLib_TLB.exKeepOriginalColor;
			OverlaidType := EXG2ANTTLib_TLB.exOverlaidBarsOffset;
		end;
	end;
	Columns.Add('Column');
	with Items do
	begin
		AddBar(AddItem('Item 1'),'Task','1/2/2001','1/4/2001',Null,Null);
		AddBar(AddItem('Item 2'),'Task','1/3/2001','1/7/2001',Null,Null);
		h := AddItem('Item 3');
		AddBar(h,'Task','1/8/2001','1/12/2001',Null,Null);
		ItemBar[h,'',EXG2ANTTLib_TLB.exBarColor] := OleVariant(255);
	end;
	EndUpdate();
end
|
|
1603
|
How can I show my custom bars in the histogram (method 2)
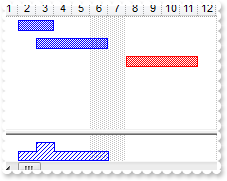
with G2antt1 do
begin
	BeginUpdate();
	with Chart do
	begin
		PaneWidth[False] := 64;
		FirstVisibleDate := '1/1/2001';
		HistogramVisible := True;
		HistogramHeight := 32;
		Bars.Item['Task'].HistogramPattern := EXG2ANTTLib_TLB.exPatternBDiagonal;
	end;
	Columns.Add('Column');
	with Items do
	begin
		AddBar(AddItem('Item 1'),'Task','1/2/2001','1/4/2001',Null,Null);
		AddBar(AddItem('Item 2'),'Task','1/3/2001','1/7/2001',Null,Null);
		h := AddItem('Item 3');
		AddBar(h,'Task','1/8/2001','1/12/2001',Null,Null);
		ItemBar[h,'',EXG2ANTTLib_TLB.exBarColor] := OleVariant(255);
	end;
	EndUpdate();
end
|
|
1602
|
How can I show my custom bars in the histogram (method 1)
with G2antt1 do
begin
	BeginUpdate();
	with Chart do
	begin
		PaneWidth[False] := 64;
		FirstVisibleDate := '1/1/2001';
		HistogramVisible := True;
		HistogramHeight := 32;
		Bars.Item['Task'].HistogramPattern := EXG2ANTTLib_TLB.exPatternBDiagonal;
		with Bars.Copy('Task','MyBar') do
		begin
			HistogramPattern := EXG2ANTTLib_TLB.exPatternFDiagonal;
			Color := $ff;
			HistogramColor := Color;
		end;
	end;
	Columns.Add('Column');
	with Items do
	begin
		AddBar(AddItem('Item 1'),'Task','1/2/2001','1/4/2001',Null,Null);
		AddBar(AddItem('Item 2'),'Task','1/3/2001','1/7/2001',Null,Null);
		AddBar(AddItem('Item 3'),'MyBar','1/8/2001','1/12/2001',Null,Null);
	end;
	EndUpdate();
end
|
|
1601
|
Do you have any Fit-To-Page options when printing the control
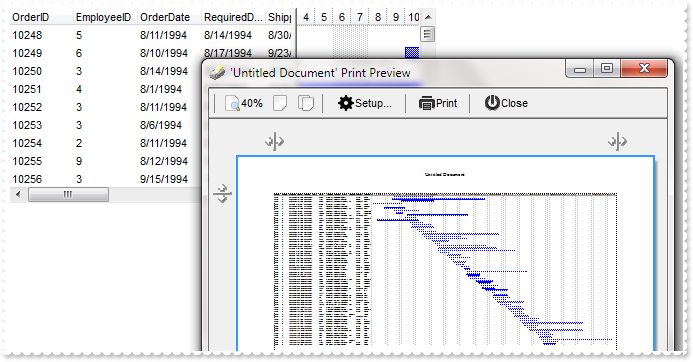
// AddItem event - Occurs after a new Item has been inserted to Items collection.
procedure TForm1.G2antt1AddItem(ASender: TObject; Item : HITEM);
begin
	with G2antt1 do
	begin
		with Items do
		begin
			AddBar(Item,'Task',CellValue[OleVariant(Item),OleVariant(2)],CellValue[OleVariant(Item),OleVariant(4)],Null,Null);
		end;
	end
end;

with G2antt1 do
begin
	BeginUpdate();
	ColumnAutoResize := False;
	ContinueColumnScroll := False;
	rs := (IUnknown(ComObj.CreateComObject(ComObj.ProgIDToClassID('ADOR.Recordset'))) as ADODB_TLB.Recordset);
	with rs do
	begin
		Open('Orders','Provider=Microsoft.ACE.OLEDB.12.0;Data Source=C:\Program Files\Exontrol\ExG2antt\Sample\Access\misc.accdb',3,3,Null);
	end;
	DataSource := (IUnknown(rs) as ADODB_TLB.Recordset);
	Chart.FirstVisibleDate := '8/4/1994';
	EndUpdate();
	with (IUnknown(ComObj.CreateComObject(ComObj.ProgIDToClassID('Exontrol.Print'))) as EXPRINTLib_TLB.Print) do
	begin
		Options := 'FitToPage = On';
		PrintExt := (IUnknown(G2antt1.DefaultInterface) as EXG2ANTTLib_TLB.G2antt);
		Preview();
	end;
end
|